Figure 4.
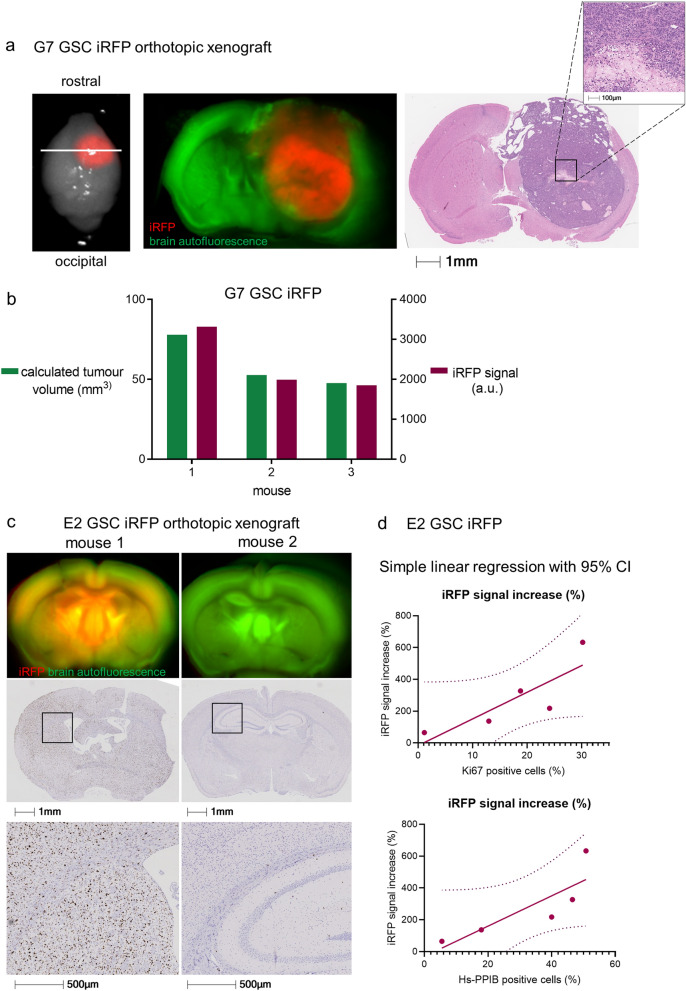
iRFP signal correlates with histological tumour burden. (a) Representative ex vivo PEARL and Odyssey scans of G7 GSC iRFP tumour in a mouse brain after resection (left), and on coronar section (middle, denoted by white line in left image) in comparison to matching H&E stain (right). 700 nm scan (red) was used to visualise the tumour, brain autofluorescence was detected in 800 nm channel (green). (b) G7 GSC iRFP signal detected with PEARL imager (a.u., arbitrary units) corresponds with calculated spherical tumour volume (mm3), extrapolated from mean diameter in H&E stains. (c) Upper panel: Odyssey scans of coronar sections from E2 GSC iRFP bearing mice. 700 nm scan (red) was used to visualise tumours, brain autofluorescence was detected in 800 nm channel (green). Middle and lower panel: corresponding Ki67 staining and magnification. (d) Simple linear regression correlating E2 GSC iRFP signal with percentage of Ki67 positive tumour cells and Hs-PPIB-positive tumour cells in five mice, quantified with Halo analysis software (Ki67: p = 0.0755, Spearman correlation r = 0.9, Hs-PPIB: p = 0.0773, Spearman correlation r = 1).

