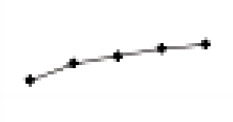
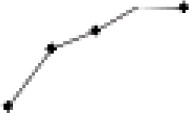
Table 2A.
Utilization of certain proton pump inhibitors (PPIs’) over the last 5 years in Hungary (organized in descending order based on the data from 2018)—number of packages.
| ATC | Active Ingredient | 1,000 packages (share in %) | trend | ||||
|---|---|---|---|---|---|---|---|
| 2014 | 2015 | 2016 | 2017 | 2018 | |||
| A02BC02 | pantoprazole | 3171.74 | 3842.92 | 4144.39 | 4444.86 | 4603 |  |
| (54.05) | (58.22) | (60.68) | (62.21) | (64.60) | |||
| A02BC05 | esomeprazole | 1101.76 | 1210.43 | 1241.44 | 1307.98 | 1282.82 |  |
| (18.78) | (18.34) | (18.18) | (18.31) | (18.00) | |||
| A02BC04 | rabeprazole | 768.73 | 742.15 | 696.3 | 673.08 | 596.48 |  |
| (13.10) | (11.24) | (10.19) | (9.42) | (8.37) | |||
| A02BC03 | lansoprazole | 630.61 | 586.23 | 538.59 | 495.21 | 417.06 |  |
| (10.75) | (8.88) | (7.89) | (6.93) | (5.85) | |||
| A02BC01 | omeprazole | 194.97 | 218.66 | 209.74 | 223.58 | 225.52 |  |
| (3.32) | (3.31) | (3.07) | (3.13) | (3.17) | |||
| All PPIs (A02AB) | 5867.8 | 6600.4 | 6830.47 | 7144.72 | 7124.88 |  |
|
| (100.00) | (100.00) | (100.00) | (100.00) | (100.00) | |||
