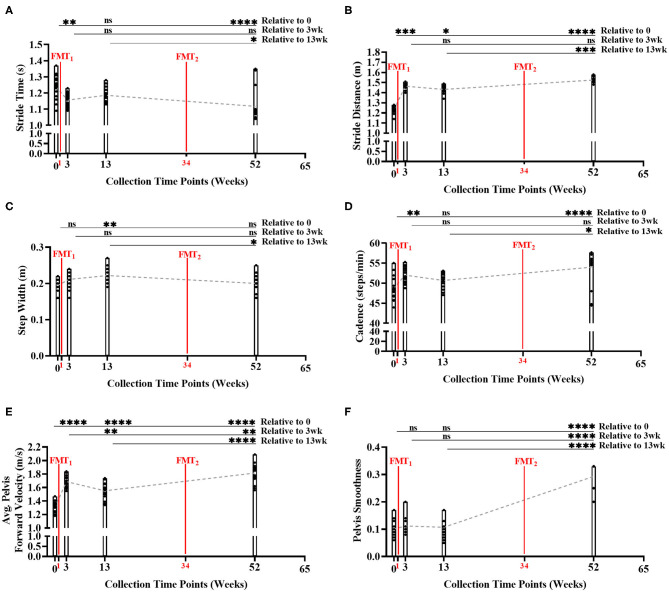
Figure 3.
Measurement of normal gait metrics changes over time of study. Five of the six gait metrics significantly improved between baseline and end of study: (A) stride time (Bonferroni: P < 0.0001); (B) stride distance (Bonferroni: P < 0.0001); (C) step width (Bonferroni: P > 0.9999); (D) cadence (Bonferroni: P < 0.0001); (E) average forward velocity (Bonferroni: P < 0.0001); and (F) pelvis smoothness (Bonferroni: P < 0.0001). Results were summarized over four collection time points using parametric repeated measures 1-way ANOVA or non-parametric Friedman's test, and adjusted with the stringent Bonferroni or Dunn's multiple group comparison post-hoc tests. Directional mean trend dotted line shown across collection time points and FMT weeks. Post-hoc test's adjusted P-values: ns, no significance, * < 0.05, ** < 0.01, *** < 0.001, **** < 0.0001.

