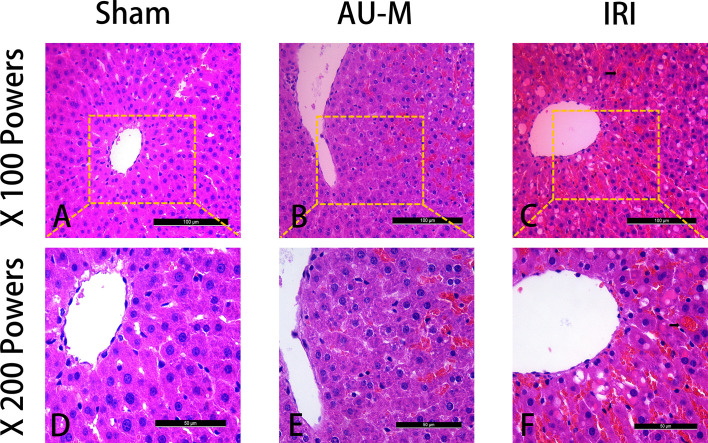
Figure 3.
Three groups of liver sections were stained with H&E. Magnifications were low (100×) and high (200×) (scale bar=100 μm and 50 μm, respectively). The sham operation group showed normal pathology (A, D). In the IRI group, the cells showed obvious degeneration and necrosis with extensive hemorrhage (arrow) (C, F). The AU-M group showed mild degeneration and edema of the hepatocytes with occasional bleeding (B, E).

