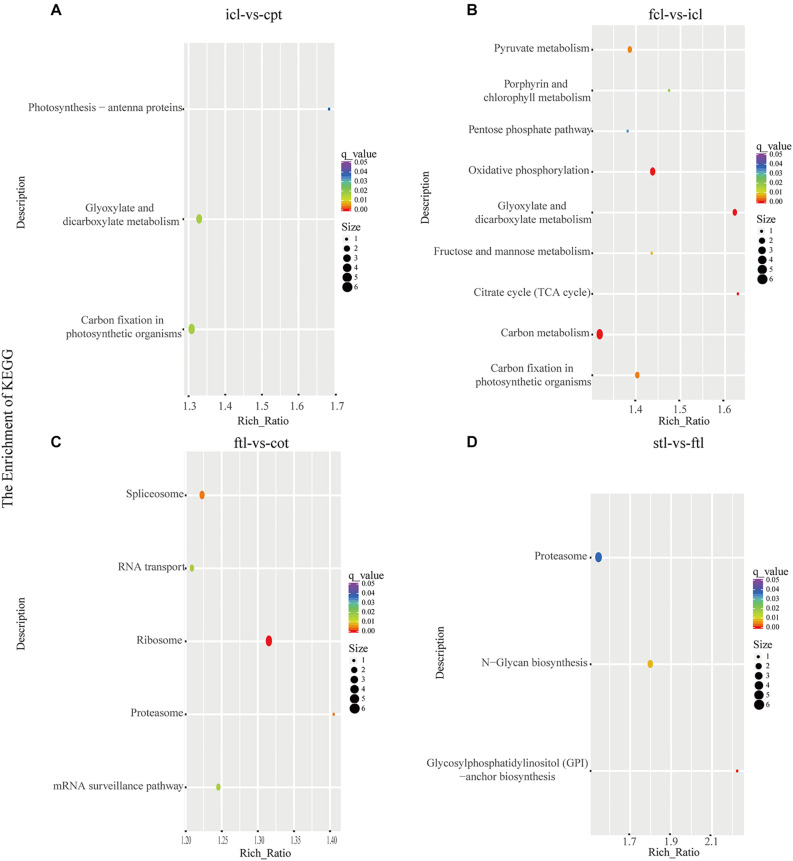
FIGURE 4.
The lncRNAs KEGG classifications of predicted target genes in different comparisons. KEGG classification of the predicted target genes in different comparisons of icl-vs.-cpt (A) and fcl-vs.-icl (B) in rice. KEGG classification of the predicted target genes in different comparisons of ftl-vs.-cot (C) and stl-vs.-ftl (D) in Arabidopsis. In both (A,B), the y-axis shows the pathway category, and the x-axis shows the richness factor. A larger richness factor indicates greater enrichment. The size of the point represents the number of related DEGs, and the color of the bubble represents the range of q-values.

