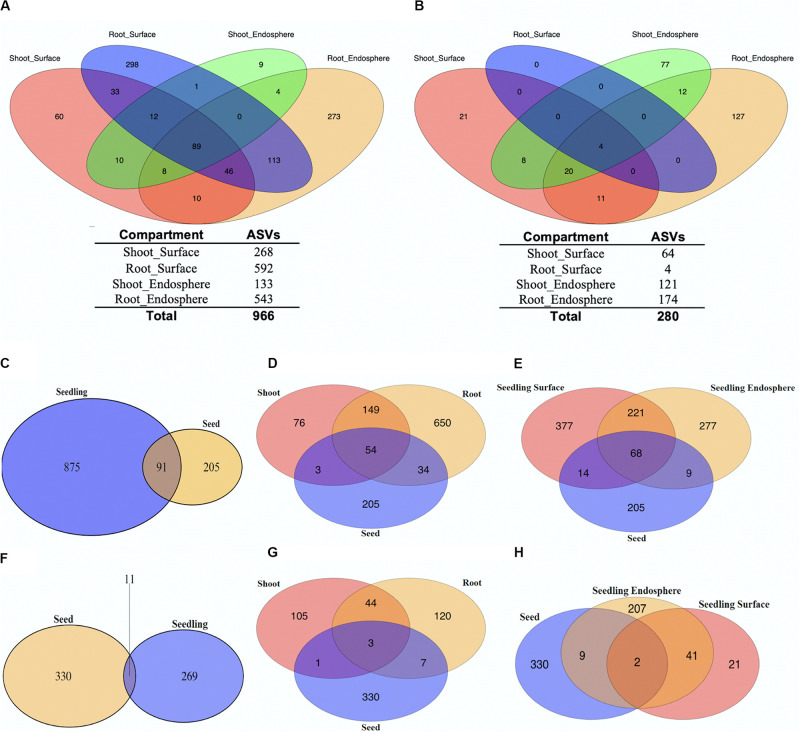
FIGURE 1.
Relationships between unique ASVs by tissue and tissue compartments. Distribution of unique bacterial (A) and fungal (B) ASVs separated by seedling compartment. The number of unique ASVs found in each seedling compartment are shown below the Venn Diagram (Pink: Shoot_Surface; Blue: Root_Surface; Green: Shoot_Endosphere; Yellow: Root_Endosphere). Unique ASVs in seedlings compared to unique ASVs in seeds (C–H). Distribution of unique bacterial (C–E) and fungal (F–H) ASVs separated by tissue compartments.

