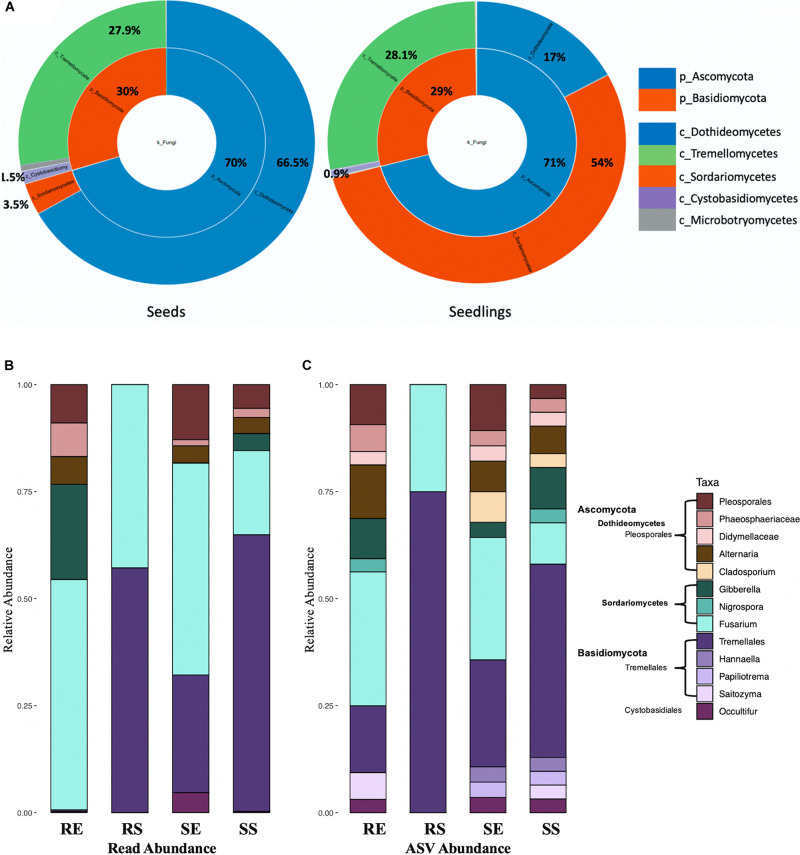
FIGURE 5.
Fungal taxon composition for microbial communities. Comparison of seeds and seedlings data at phylum and order level (A). Fungal genera bar graphs based on reads abundance (B) and ASVs abundance (C) for 4 different tissue compartments (Top genera with > 1% total reads). Tissue compartment: RE, Root Endosphere; RS, Root Surface; SE, Shoot Endosphere; SS, Shoot Surface.

