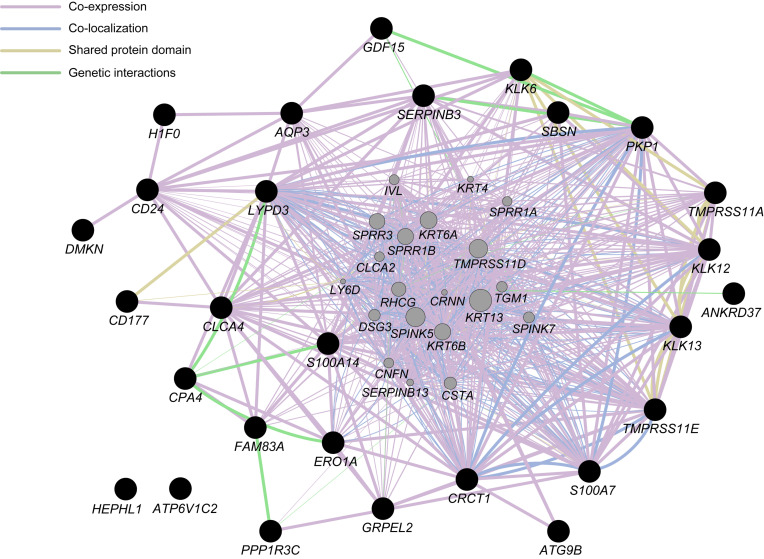
FIGURE 3.
Network analysis for differentially expressed genes (DEGs), with the exception of long non-coding RNA or processed transcript, identified in the present study (closed black circles) with the use of GeneMANIA ver. 3.5.1 Cytoscape plugin via Cytoscape ver. 3.7.1. Interactions between the DEGs are indicated by bold lines. Genes represented by gray circles are putative mediators of the interactions between DEGs.

