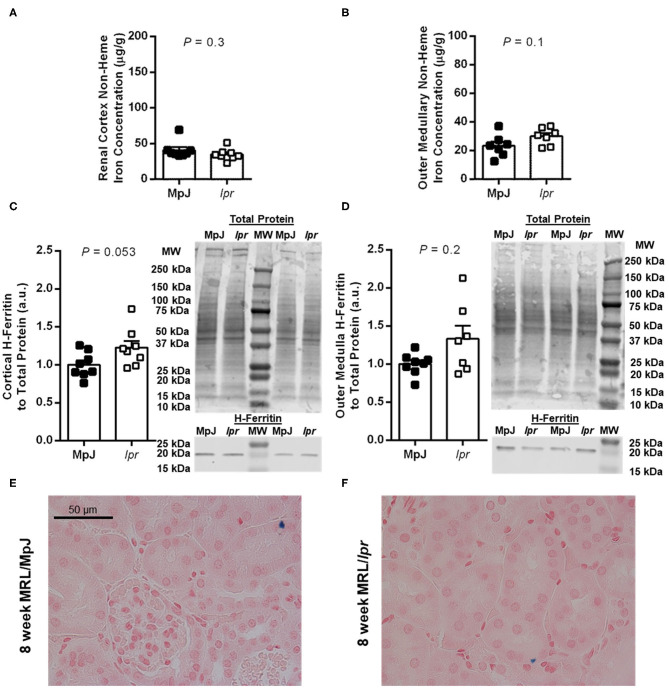
Figure 2.
Measures of renal iron accumulation in 8-week-old male MRL mice. Renal tissue non-heme iron concentrations, expressed per g of wet tissue weight, were measured separately in renal cortex (A) and outer medulla (B) of MRL/MpJ and MRL/lpr mice. Western blot analysis of ferritin heavy chain (H-ferritin) was performed on renal cortical tissue (C) and outer medullary tissue (D), with the densitometric ratio of H-ferritin to total protein staining presented as arbitrary units (a.u.) after normalizing to the average of the MRL/MpJ group within each blot. Representative images of H-ferritin staining are shown (MW, molecular weight markers), with total protein staining of the same lanes shown above (please note that the difference in intensity of the molecular weight markers between images is due to the two scans being performed at different times and to the total protein stain highlighting the markers). Data are presented as individual data points as well as mean ± SEM for each group, with n = 8 per group except for (B) where one sample was missing per group, and (D) where one sample was missing from the MRL/lpr group. P-values were determined by Student's unpaired t-test (A–C) or Mann-Whitney U-test (D). (E,F) Show areas of renal cortex from kidney sections stained with Perl's Prussian blue [blue pigment; MRL/MpJ, (E); MRL/lpr, (F)].

