Figure 3.

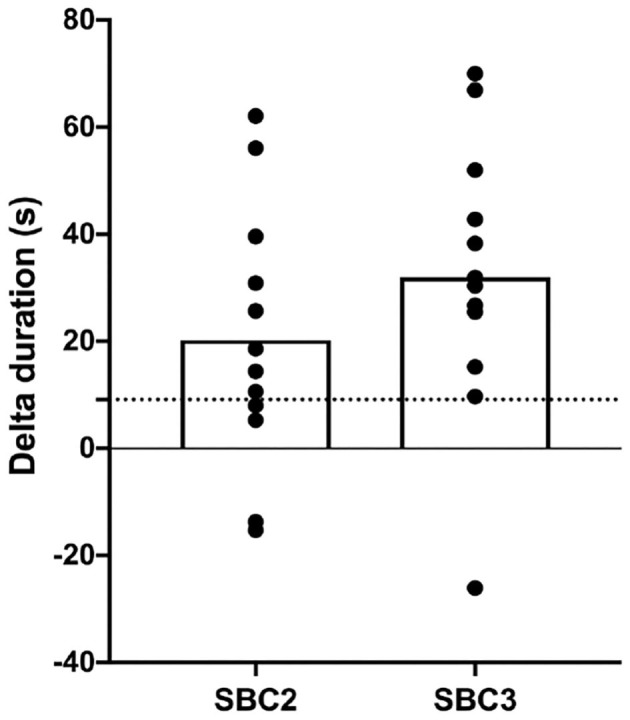
Individual changes (with mean; clear bar) in TTE duration compared to PLA condition; SBC2, 0.2 g.kg−1 BM NaHCO3; SBC3, 0.3 g.kg−1 BM NaHCO3; PLA, sodium chloride (placebo); dashed horizontal line depicts SWC in performance (9.1 s).

Individual changes (with mean; clear bar) in TTE duration compared to PLA condition; SBC2, 0.2 g.kg−1 BM NaHCO3; SBC3, 0.3 g.kg−1 BM NaHCO3; PLA, sodium chloride (placebo); dashed horizontal line depicts SWC in performance (9.1 s).