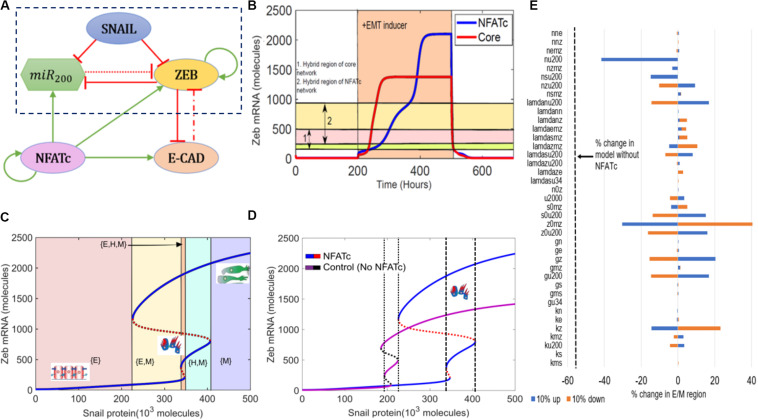
FIGURE 1.
NFATc inhibits the progression of complete EMT. (A) Schematic representation of the EMT network coupled with NFATc. Red bars denote inhibition, green arrows indicate activation. Solid arrows represent transcriptional regulation, dash-dotted line represents indirect regulation and dotted line represent micro-RNA mediated regulation. (B) Temporal dynamics of ZEB mRNA levels in a cell starting in an epithelial phenotype, when exposed to a high level of S = 330,000 molecules (orange-shaded region) for circuit shown in (A) (NFATc) and that shown in the dotted rectangle in (A) (core). Horizontal shaded regions denote the levels of ZEB mRNA corresponding to hybrid E/M region of both NFATc (cream and pink shaded region) and the core (yellow and pink shaded region) networks. (C) Bifurcation diagram of ZEB mRNA levels as driven by SNAIL signal for the circuit shown in (A). Curves denote the value of ZEB mRNA upon equilibration, where continuous curves stand for stable steady states and dotted lines represent unstable solutions. Different colored shaded regions show the existence/co-existence of different phenotypes; cartoons depict epithelial (E), hybrid E/M (H), and mesenchymal (M) states. (D) Bifurcation diagrams indicating the ZEB mRNA levels for increasing SNAIL levels for the coupled EMT-NFATc circuit (solid blue and dotted red curve) and the core EMT circuit (solid purple and dotted black curve). (E) Sensitivity analysis indicating percent change in the interval of SNAIL levels for stable hybrid E/M region, when corresponding parameter values are varied by ±10%. The black dotted line indicates the percent change in the stable hybrid region in the absence of NFATc (core network) when compared to the coupled network with NFATc.

