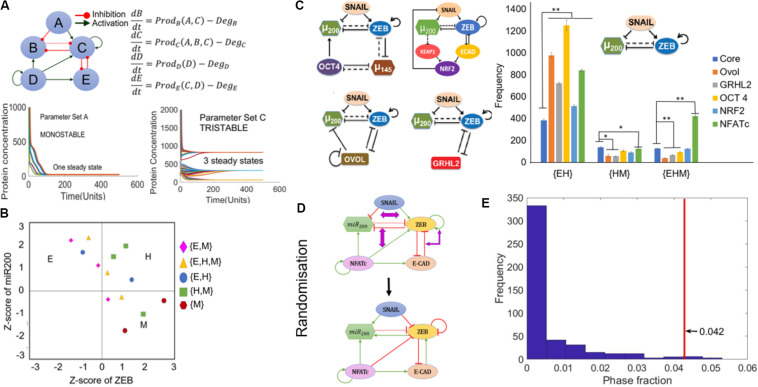
FIGURE 4.
RACIPE analysis of NFATc network. (A) Schematic of coupled EMT-NFATc network simulated for various parametric combinations through RACIPE. For different parameters, dynamics of this regulatory network, as modeled by a set of ordinary differential equations representing the interactions in the network, can end up in a mono- or a multi-stable regime. (B) Phases are calculated after z-scores of ZEB and miR200 levels calculated from RACIPE are used to classify steady states obtained from each parameter set into Epithelial (E) – (high miR-200, low ZEB)/Hybrid (H) – (high miR200, high ZEB)/Mesenchymal (M) – (low miR-200, high ZEB) phenotypes. Different symbols denote different phases. (C) Frequencies of different multi-stable phases for core EMT network (SNAIL/miR-200/ZEB), its coupling to other PSFs (shown to the left of the graph) and coupled EMT-NFATc coupled network. Error bars denote standard deviation; n = 3. (D) Depiction of network randomization methodology. For every node, the degree of incoming and outgoing edges are conserved but not necessarily the number of inhibitory or excitatory edges arriving at or emanating from a node. (E) Frequency distribution of the {E, H, M} phase fraction for randomized networks. The red line denotes the phase fraction of {E, H, M} phase in the wild-type (WT), i.e., NFATc network. *p < 0.05, **p < 0.005 using two tailed Student’s t-test.

