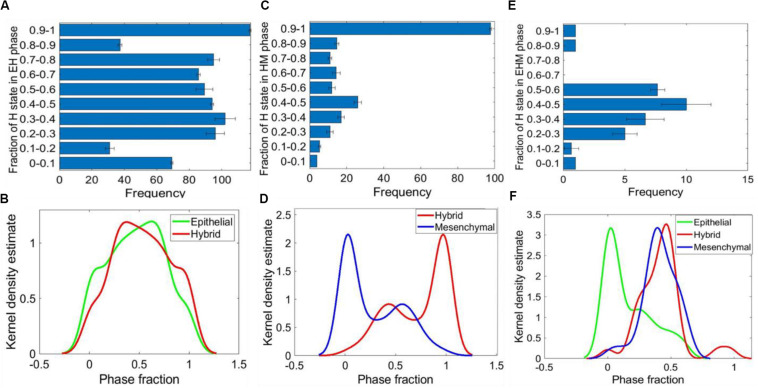
FIGURE 5.
Relative stability analysis. (A) Frequency distribution of H state in {E, H} phase. (B) Kernel density plot showing the frequency distribution of E and H states in the {E, H} phase. (C) Frequency distribution of H state in the {H, M} phase. (D) Kernel density plot showing the distribution of M and H states in the {H, M} phase. (E) Frequency distribution of H state in the {E, H, M} phase. (F) Kernel density plot showing the distribution of E, H, and M states in the {E, H, M} phase. For panels (A,C,E) the error bars represent the mean ± standard deviation for three sets of independently chosen initial conditions for a given parameter set obtained from one RACIPE run.

