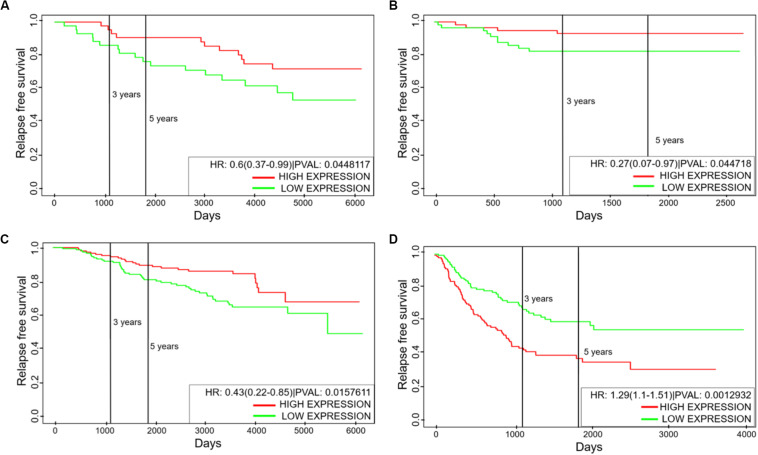
FIGURE 6.
Kaplan–Meier analysis for NFATc1 levels. (A–C) Relapse free survival for GSE6532, GSE19615, and GSE17705 (breast cancer tissue samples). (D) Relapse free survival for GSE41271 (non-small cell lung cancer tissue samples). Green curve shows the group of patients with low NFATc1; red curve shows the group with high NFATc1 levels. All cohorts are divided at median values of NFATc1; HR denotes hazard ratio; PVAL denotes p-value.

