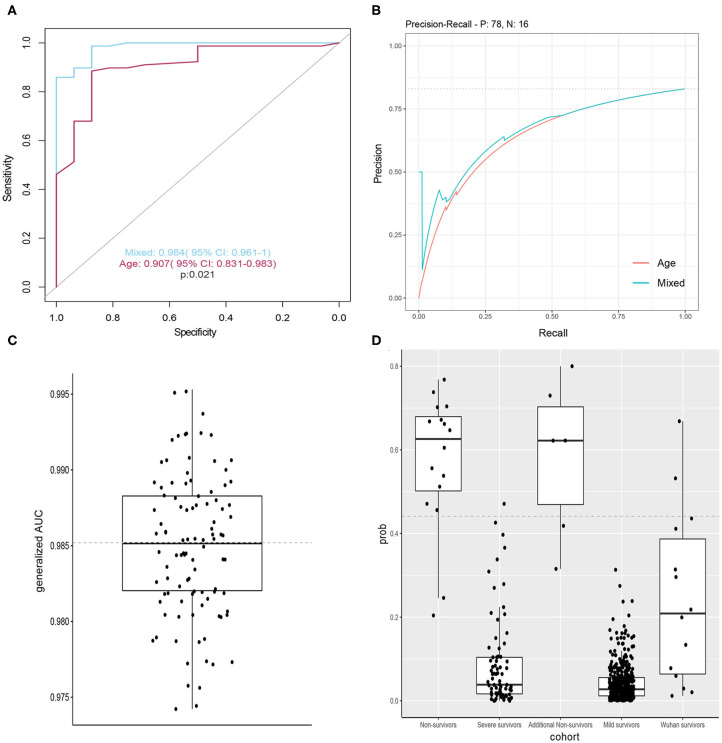
Figure 2.
Models to predict death risk. (A) Performance of the classifiers using AUCs, significance determined by single sided AUC comparison by using bootstrap method with 10,000 permutations (boot. n = 10,000). (B) Precision-recall curves of models based on mixed features and age. (C) Distribution of generalized AUC by using bootstrap sampling (n = 100). (D) Boxplots showing distribution of death probabilities among different cohorts. horizon dashed line indicates selected threshold.

