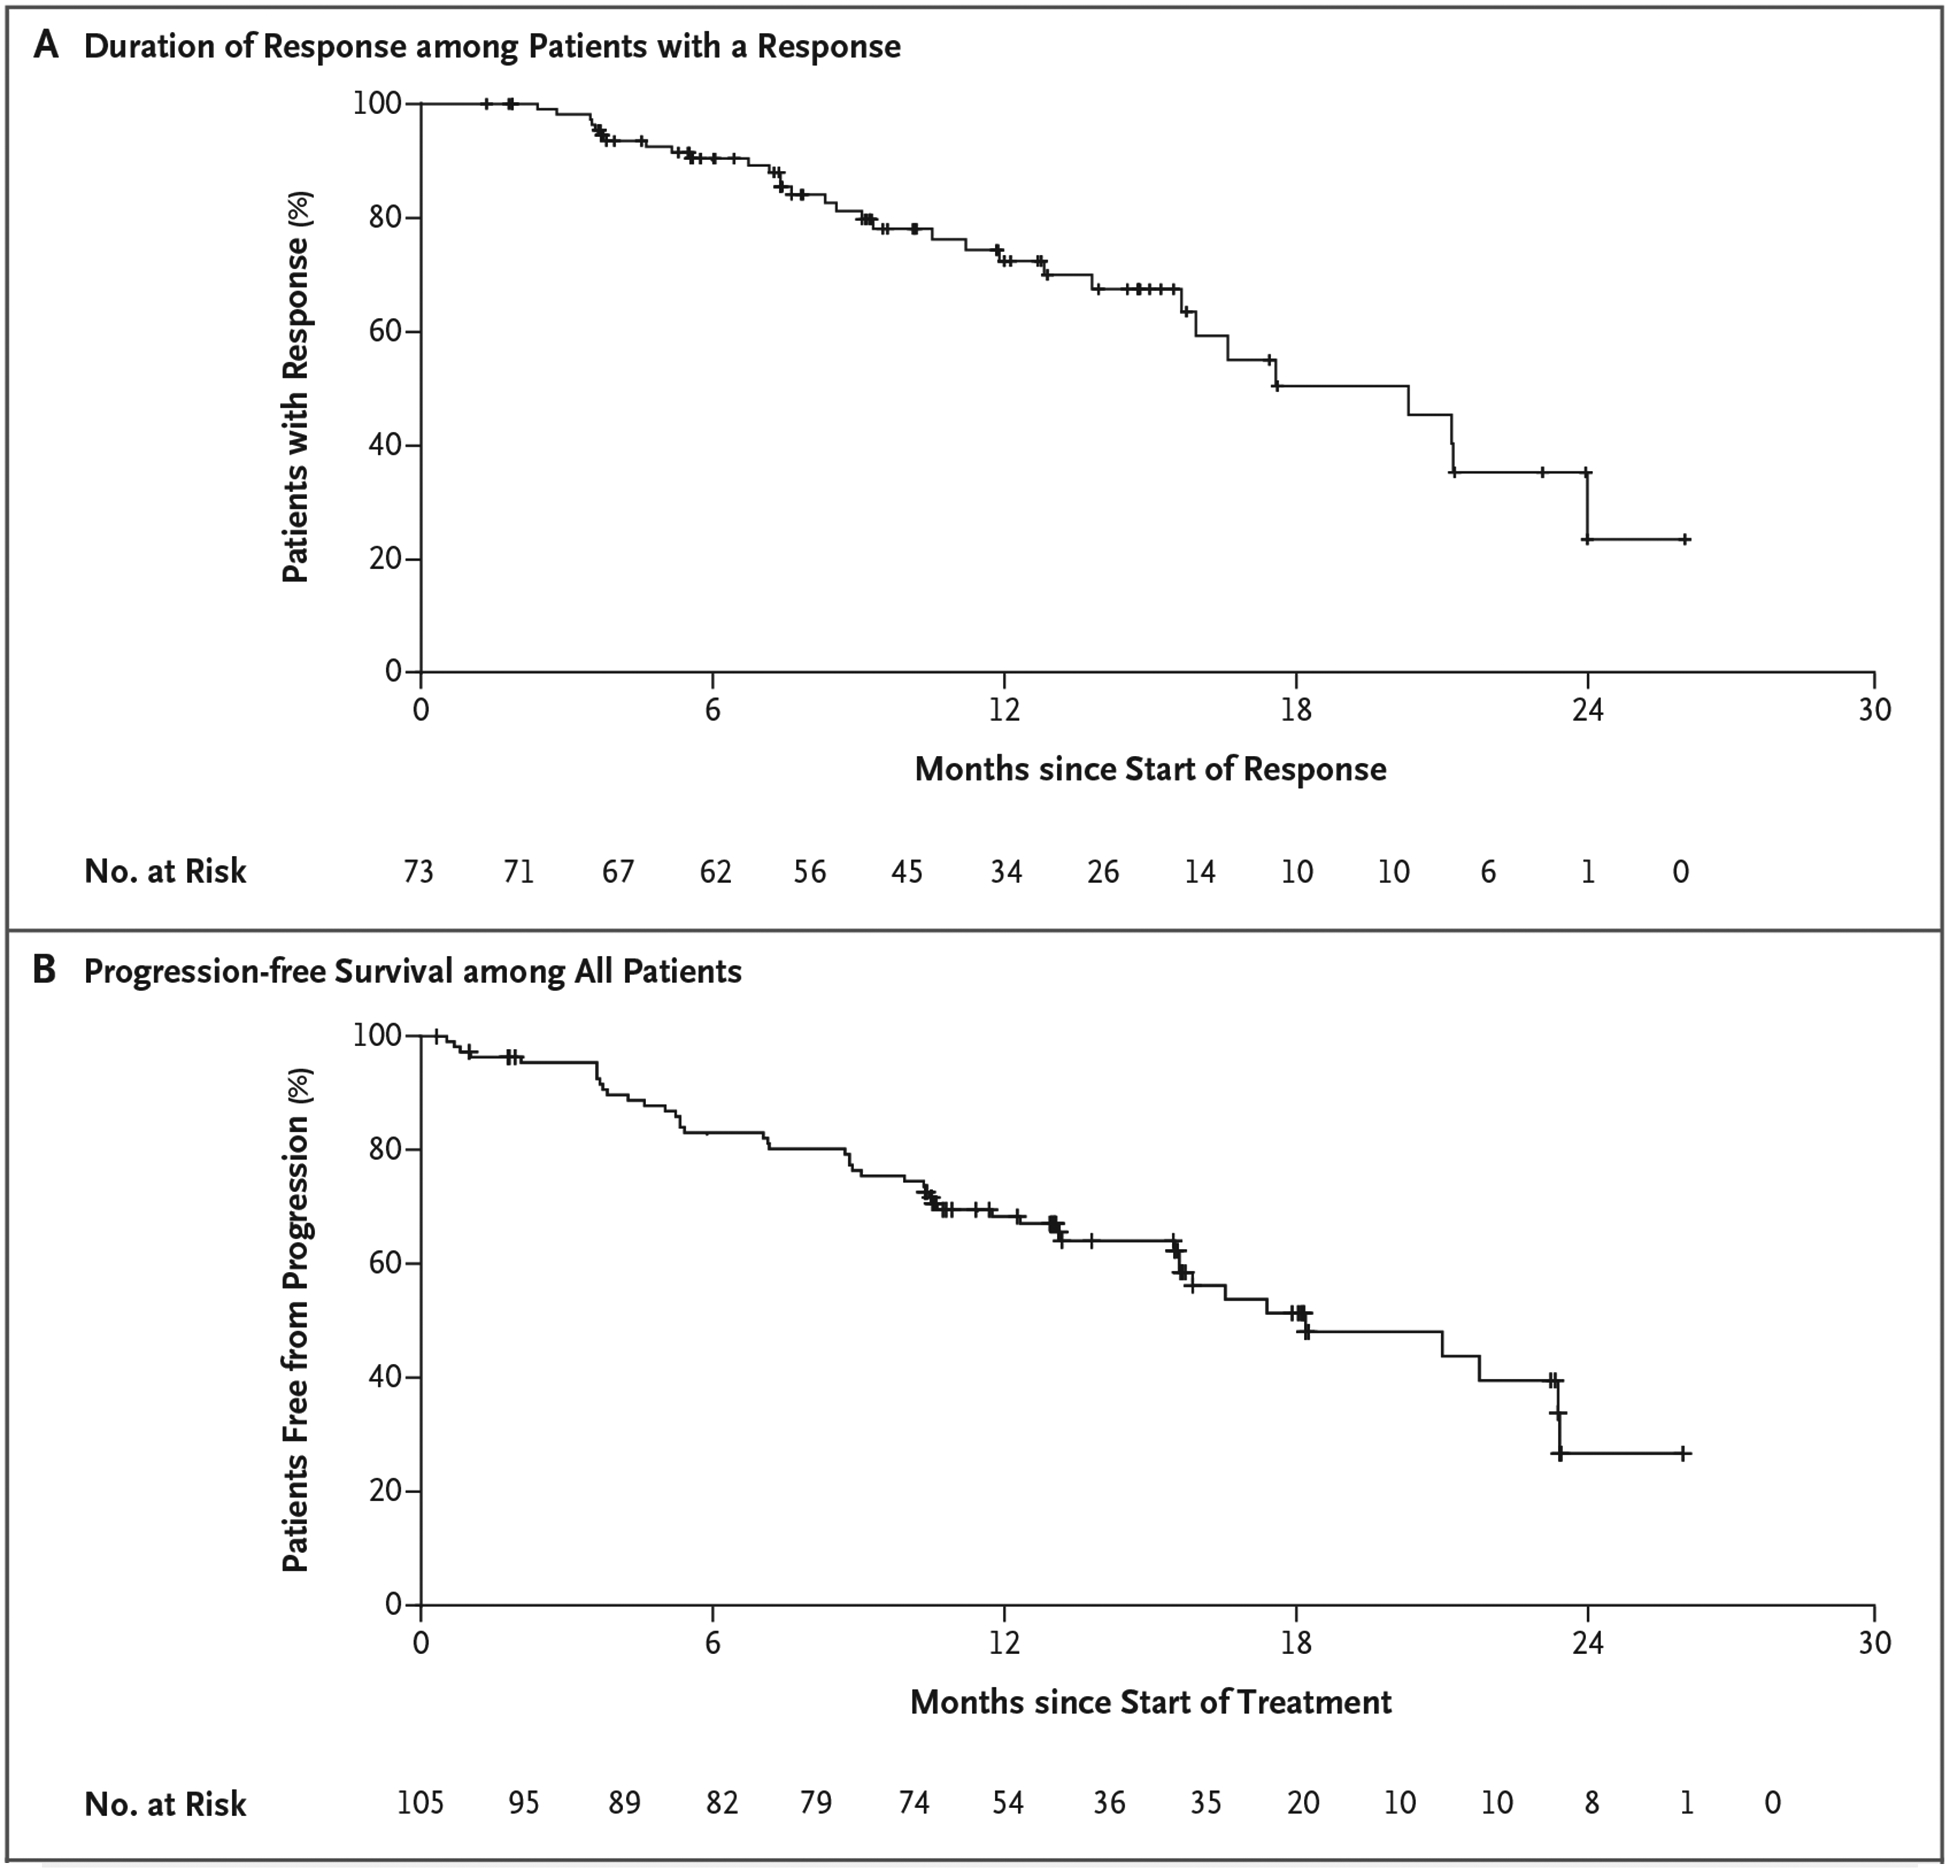
Figure 2. Kaplan–Meier Plots of the Duration of Response and Progression-free Survival.

Shown are data (according to investigator assessment) for patients who had previously received platinum-based chemotherapy. Panel A shows the duration of response among 73 patients with a confirmed response, and Panel B shows progression-free survival among all 105 patients. Tick marks indicate censored data.
