
Figure 2. . Differentially methylated CpGs and differentially methylated regions in primary biliary cholangitis patients versus controls.
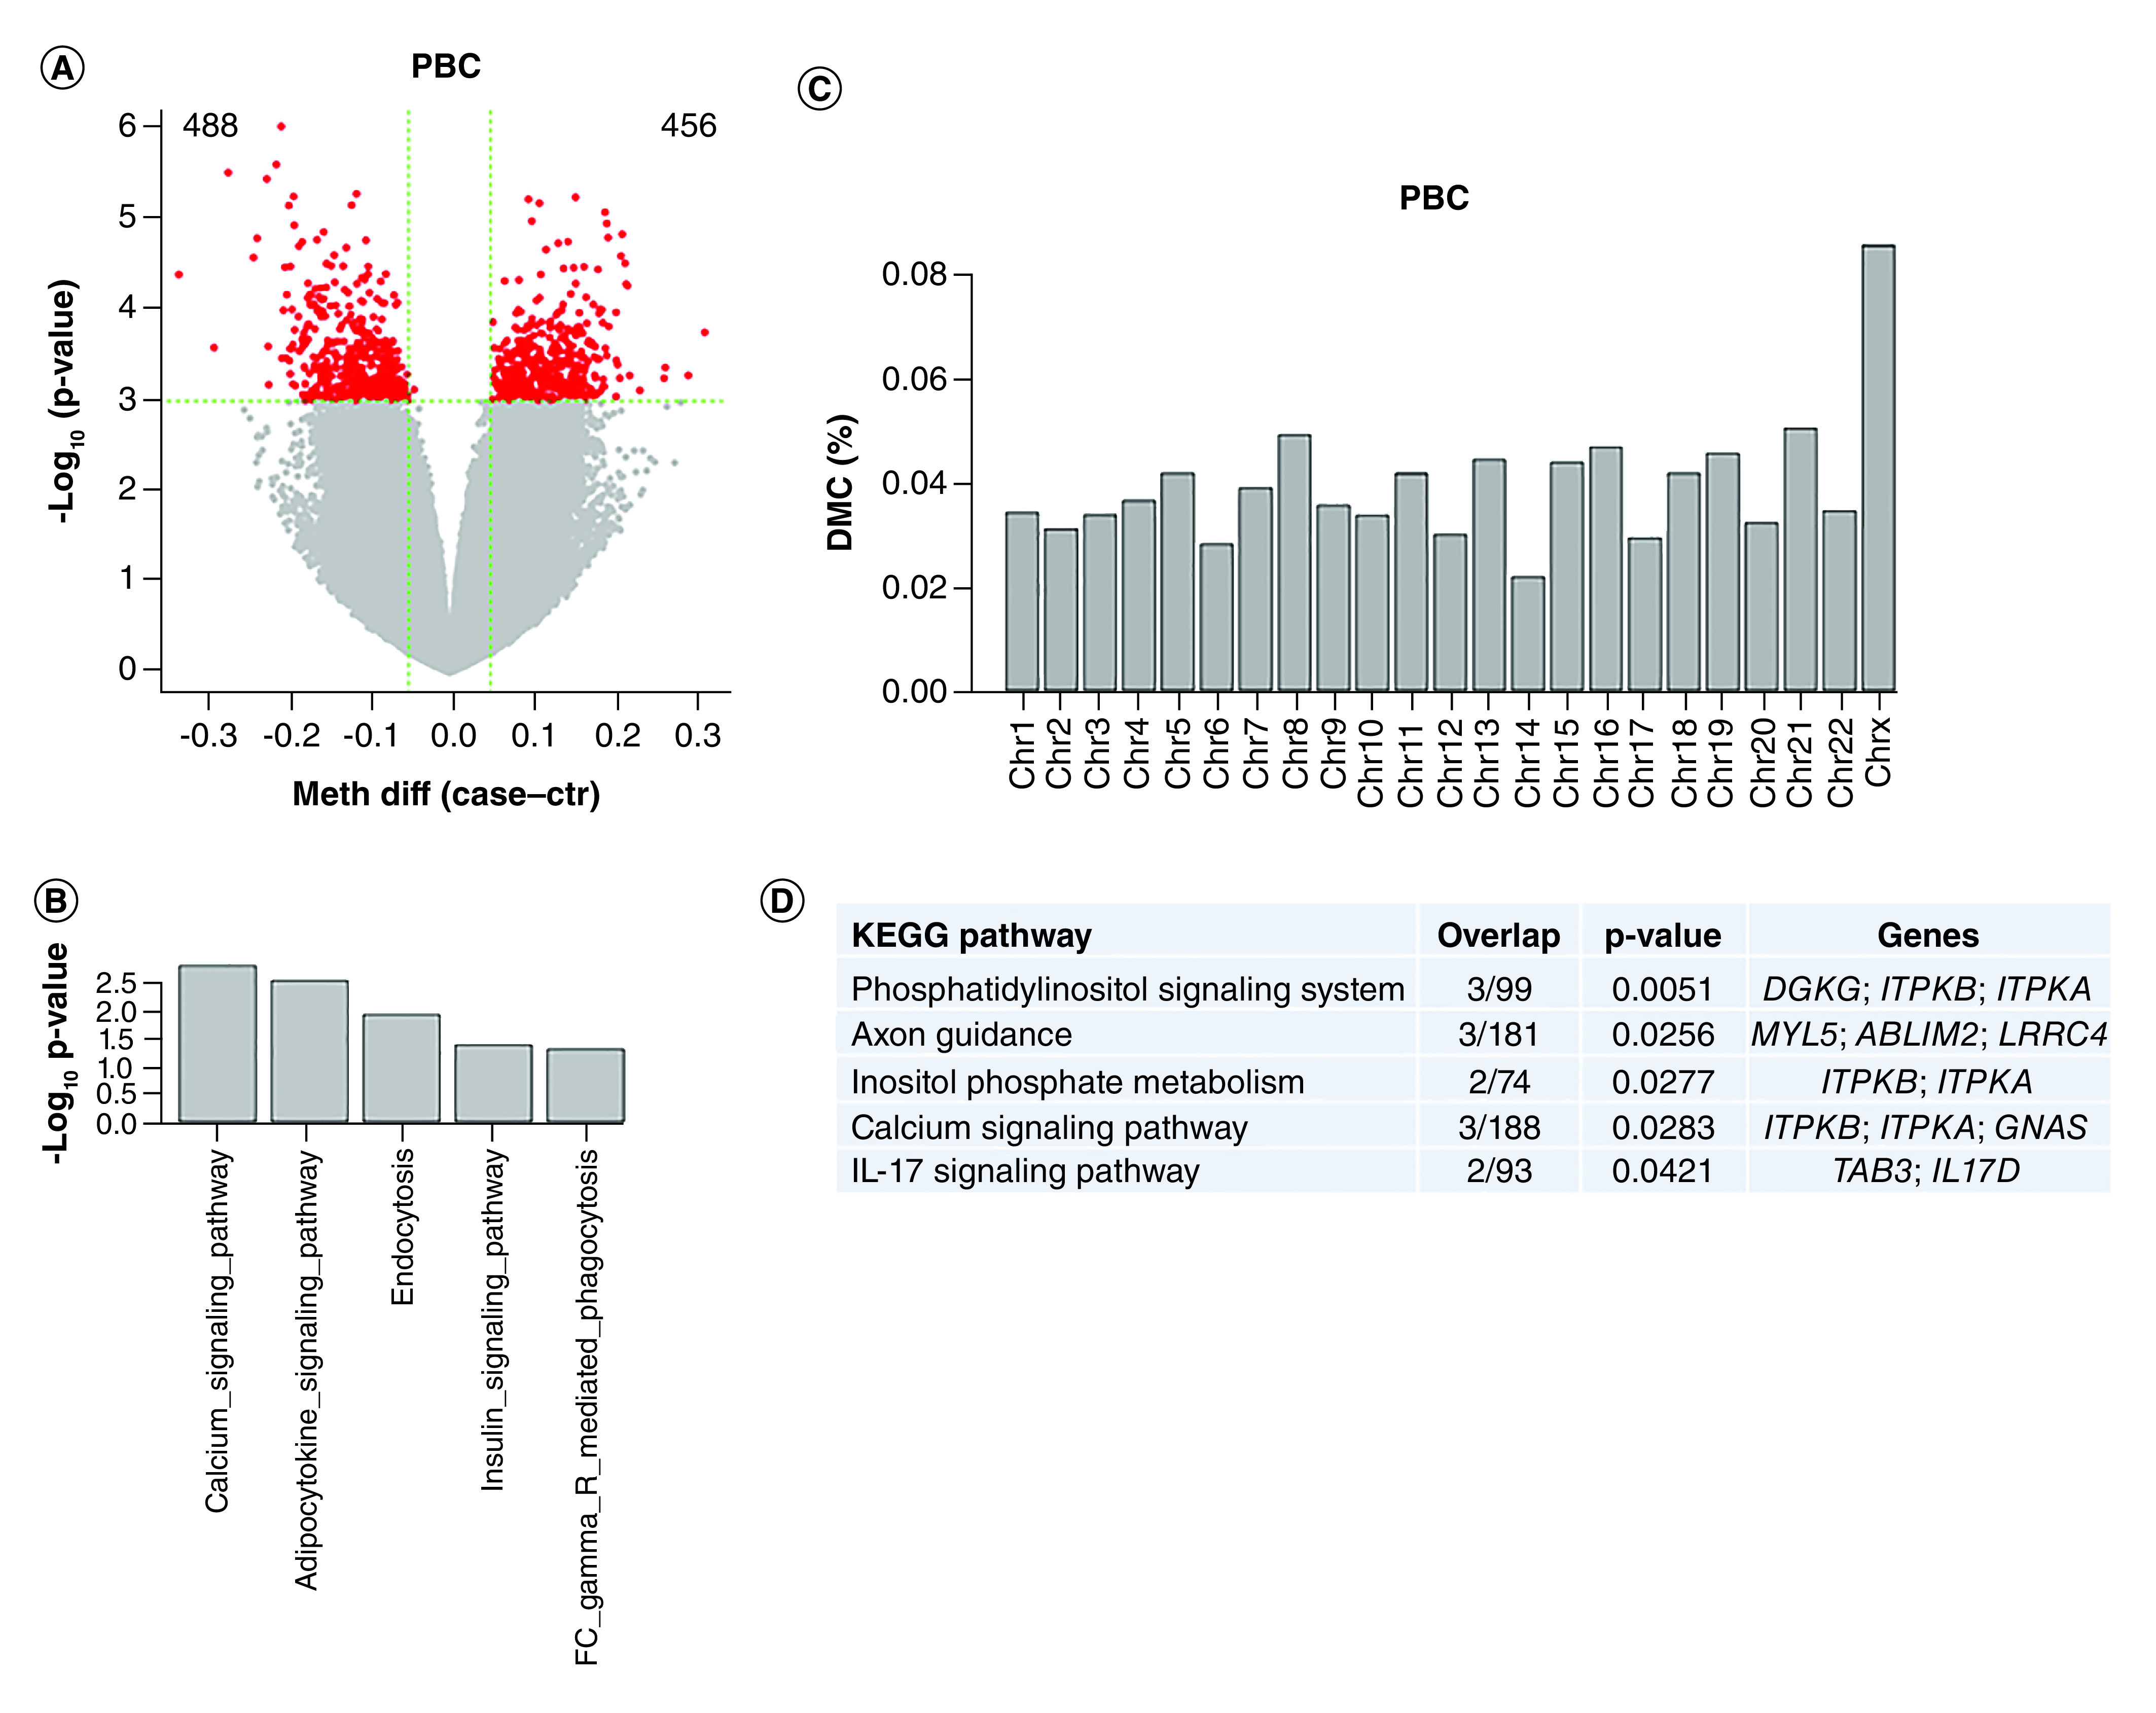
(A) Volcano plot for DMCs. The red dots are for those with p-value less than 0.001 (almost all with methylation difference >5%, the green vertical lines). The numbers on the upper corners are hyper- and hypo-methylated DMCs. (B) Significantly enriched KEGG pathways for DMC-associated genes (p < 0.05). (C) DMC distribution by chromosomes. Y axis represents % of CpGs claimed as DMCs relative to total number of CpGs at each chromosome. DMCs on Chr X are overly represented. (D) Enriched KEGG pathways for DMR-associated genes.
DMC: Differentially methylated CpG; DMR: Differentially methylated region; PBC: Primary biliary cholangitis.