
Figure 3. Relative abundance of metabolites of ATX in HLM, MLM, and RLM.
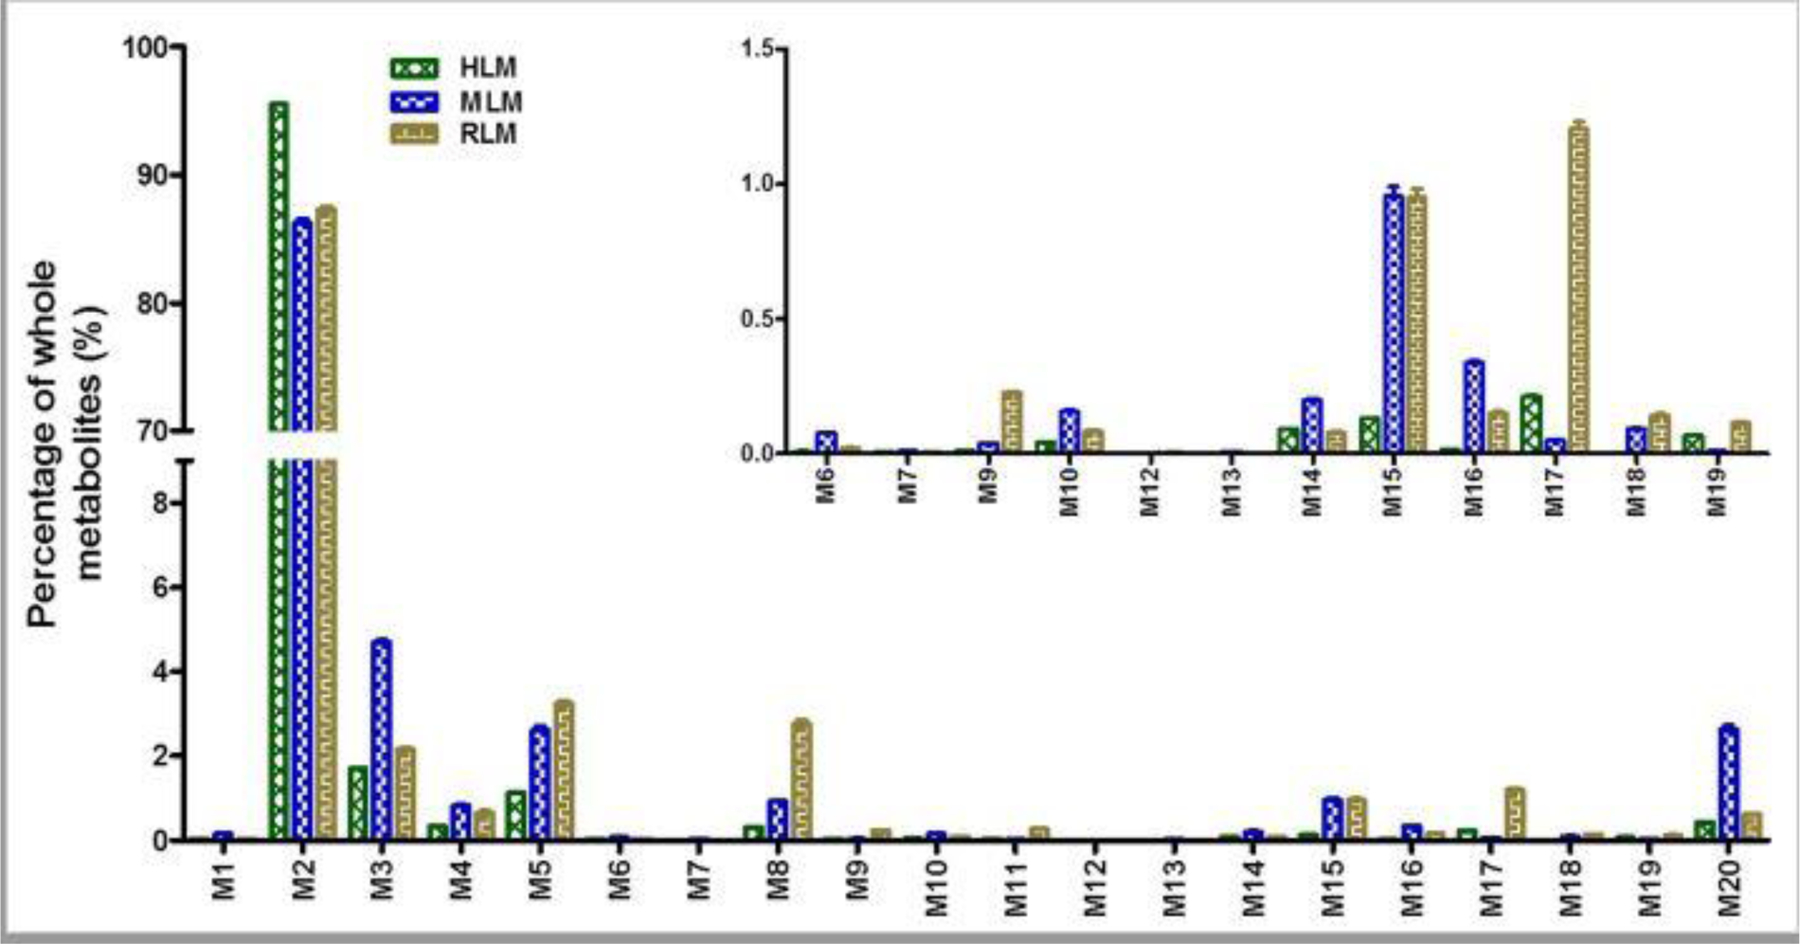
Incubations were conducted in 1X phosphate-buffered saline (1X PBS, pH 7.4), containing 25 µM ATX, 0.2 mg LM in a final volume of 190 µl. After 5 min of pre-incubation at 37 °C, the reaction was initiated by adding 10 µl of 20 mM NADPH (final concentration 1.0 mM) and continued for 30 min with gentle shaking. The relative quantification was conducted based on the peak area. The overall abundance of metabolites was set as 100% in each sample. The data are expressed as mean ± SEM (n = 3).