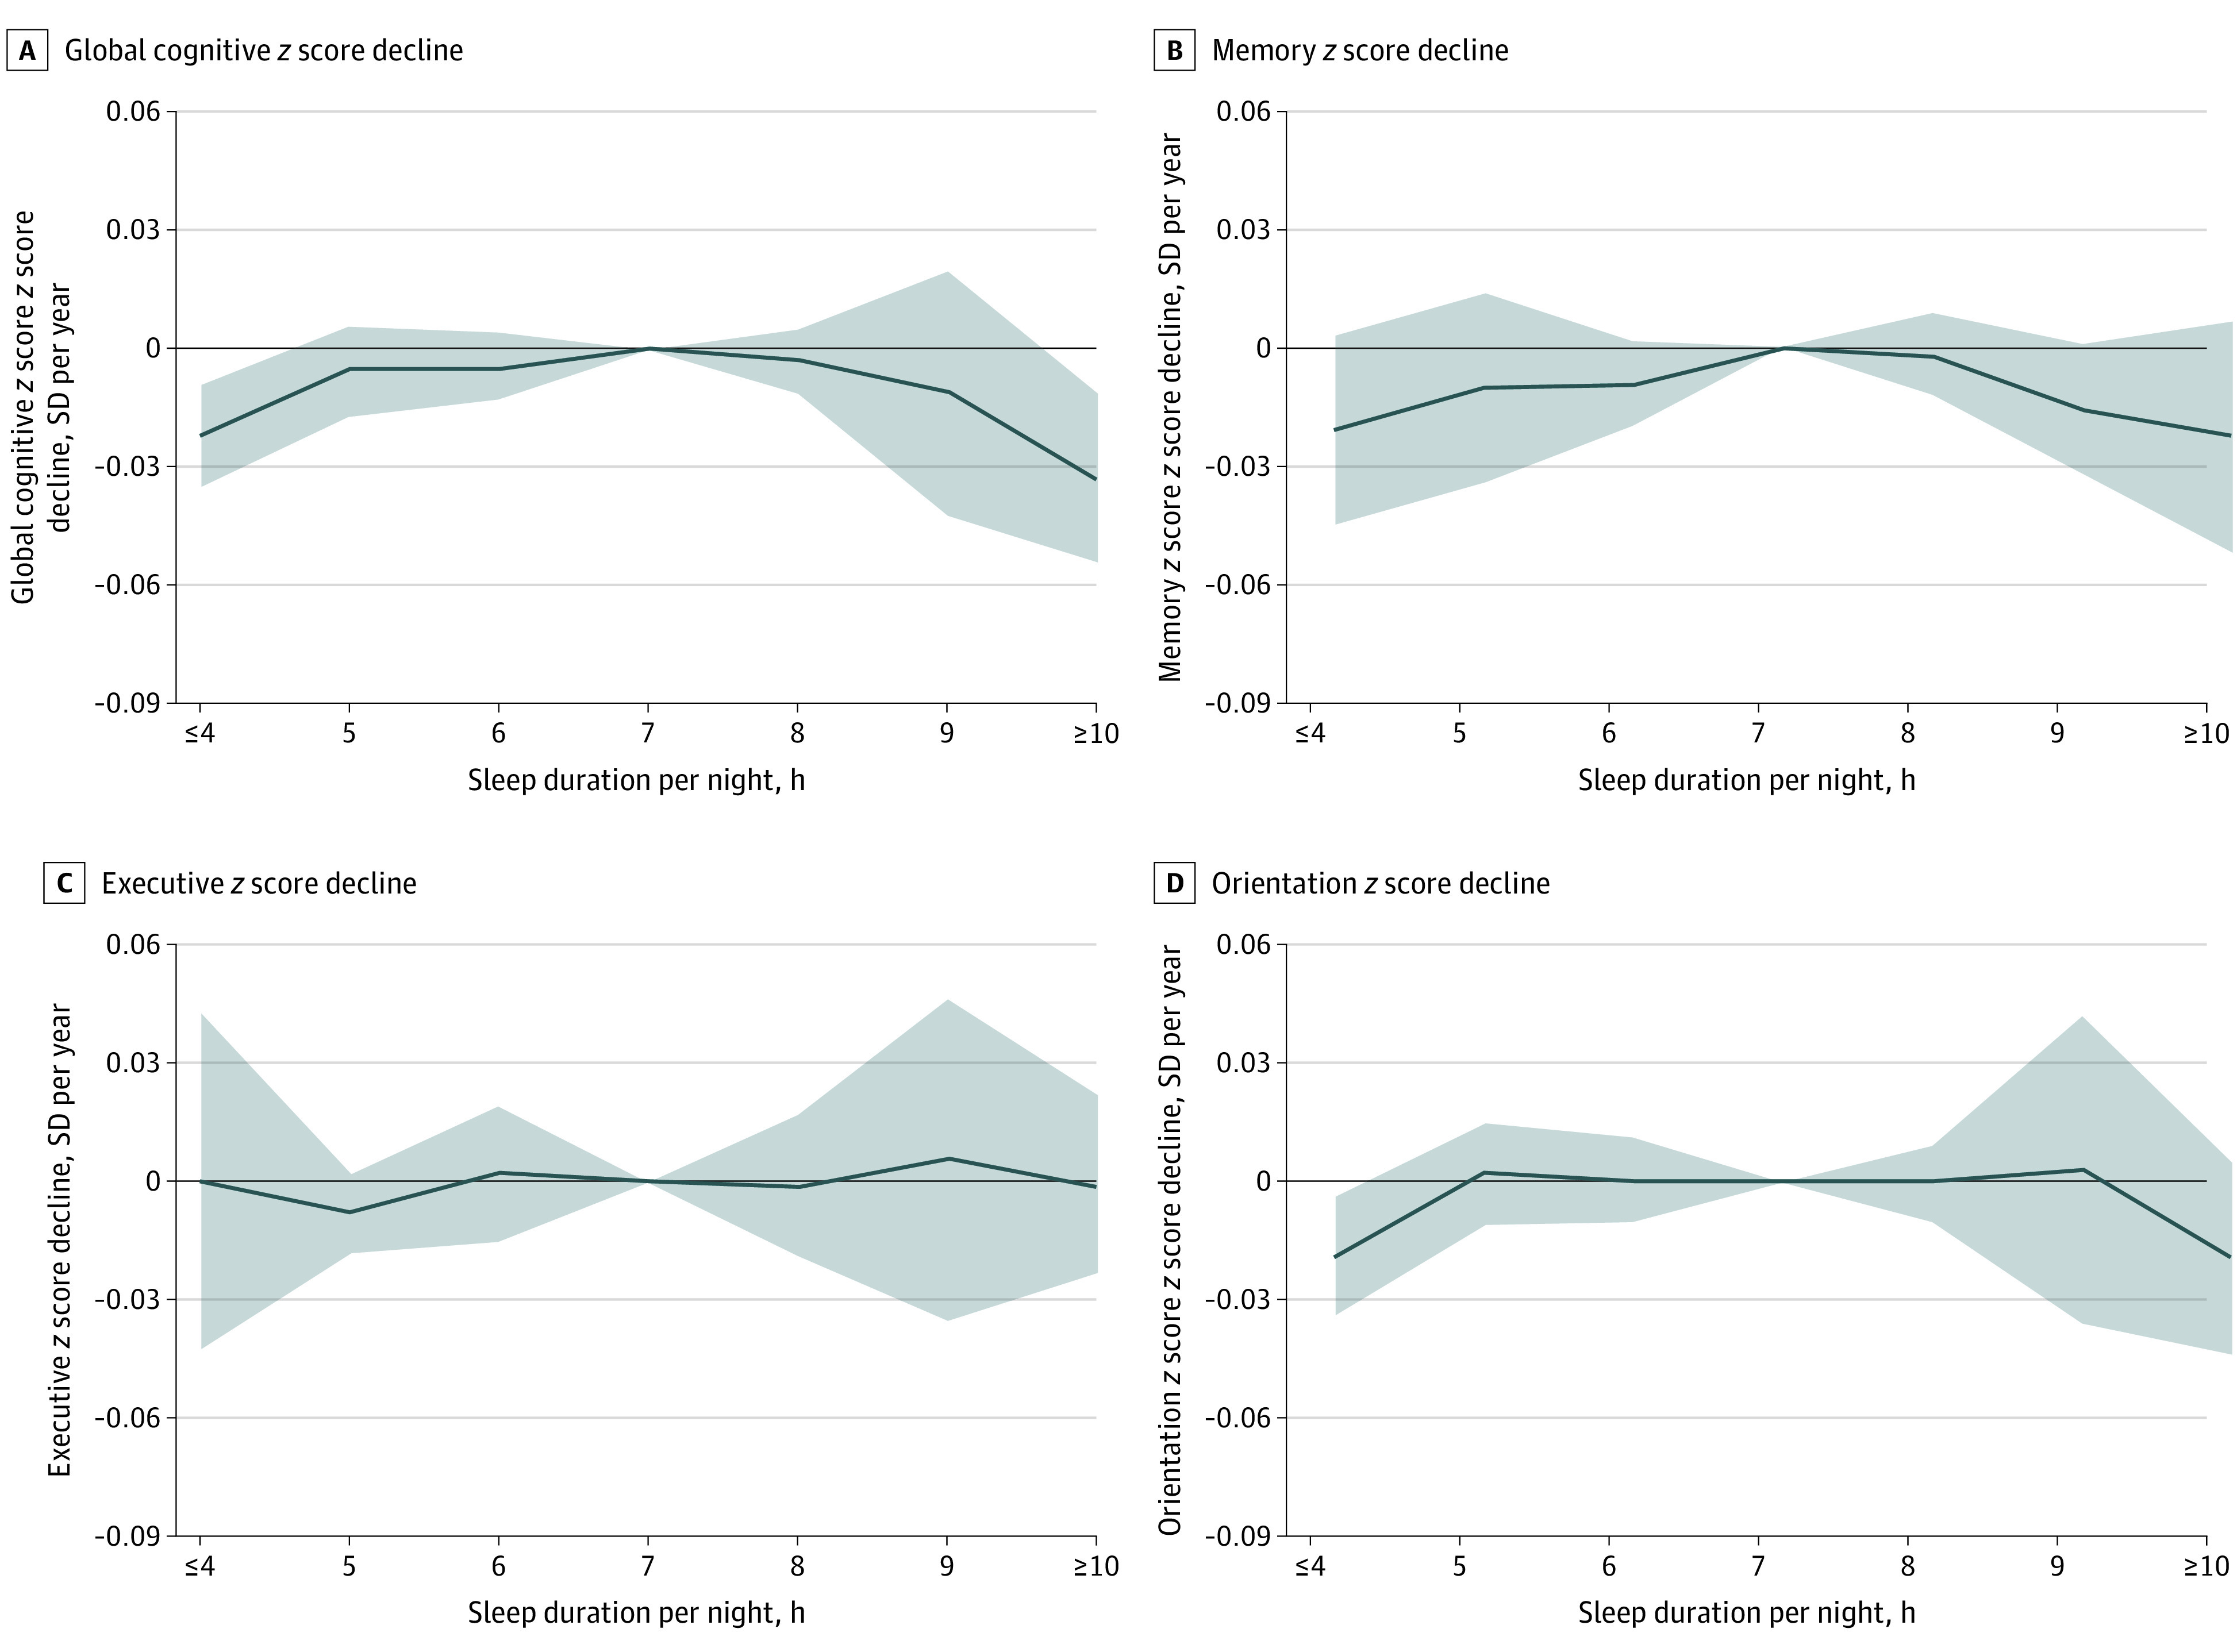
Figure 2. Mean Differences in Rate of Change in z Scores During Follow-up.

A-D, Participants who had a sleep duration of 7 hours per night served as the reference group. Solid lines represent adjusted mean differences after adjusting for sex, age, body mass index, systolic blood pressure, level of education, Center for Epidemiologic Studies Depression Scale score, cohabitation status, current smoking, alcohol consumption, diabetes, coronary heart disease, stroke, cancer, chronic lung disease, and asthma. The shaded areas represent the 95% CIs. Detailed results are listed in Table 3 and eTables 4, 5, and 6 in the Supplement.
