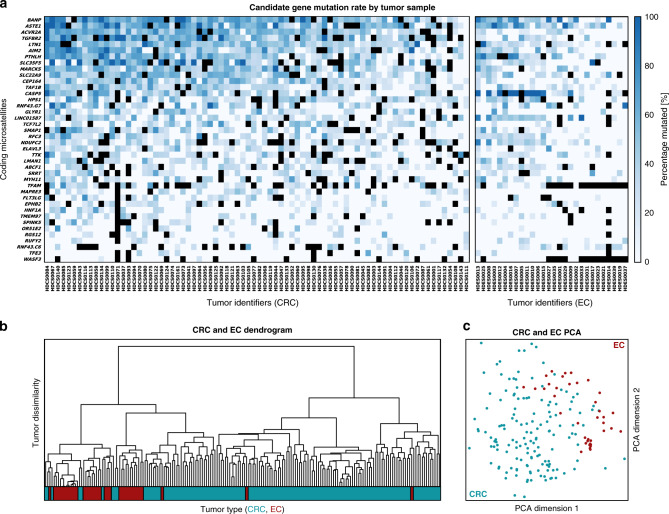
Fig. 1. Mutation frequencies of cMS in MSI CRC and EC.
a The relative frequency of mutant alleles is shown for 41 cMS (rows) in CRC and EC tumor samples (columns) derived using ReFrame. cMS were sorted top–down according to their mutation frequency indicated by blue boxes of different intensity. Dark blue represents high mutation frequency, whereas pale blue represents low mutation frequency and white absence of mutations. Black boxes indicate missing data points. The respective tumor samples are shown below each column. cMS were analyzed for both CRC and EC and are depicted separately for each tumor type (left panel: CRC, right panel: EC). The complete dataset is provided in Supplementary Fig. 2. Source data for Supplementary Fig. 2 are provided as a Source Data file. b Dendrogram of CRC and EC samples with respect to their mutation patterns where the color bar below indicates the tumor type (CRC, blue; EC, red). c Principal component analysis of EC (red) and CRC (blue) samples with respect to their mutation patterns.

