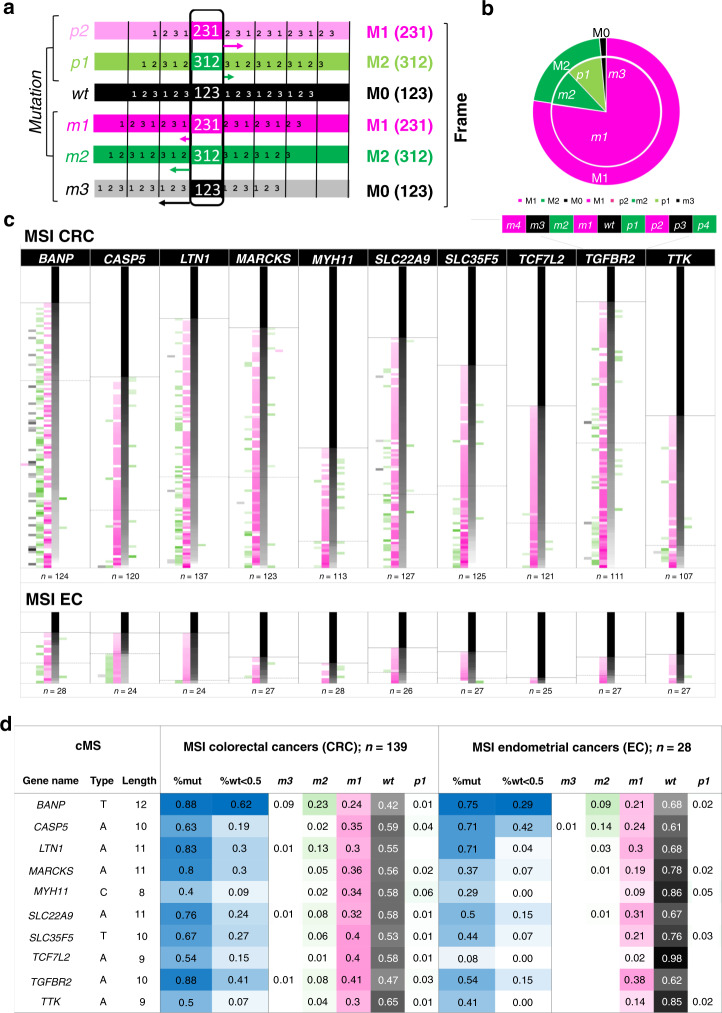
Fig. 2. Mutational pattern distribution in cMS based on ReFrame analysis.
a Scheme of frameshift mutations (m3, m2, m1, wt, p1, p2) on the left and their corresponding frames (M0, M1, M2) on the right. The numbers 1–3 indicate base triplets in the corresponding frame. Arrows mark the shift between the wt frame and the alternate frame. b Distribution of all cMS frameshift mutations (m3–p2) and their corresponding frames (M0, M1, M2) in MSI CRC quantified using ReFrame. Mutations in all MSI CRC samples were classified in corresponding reading frames (M0, black; M1, magenta; M2, green) and their overall allele ratios quantified. c The detailed mutational patterns of ten representative cMS are depicted with their respective frequency of mutation for all possible resulting frameshift mutations (m4–p4) in MSI CRC and EC (see Supplementary Fig. 3 for complete dataset). Each row constitutes one analyzed tumor sample with its related allele ratios. For each cMS, tumors were sorted by the proportion of wild-type alleles top to bottom. The number of samples analyzed for a certain candidate is indicated below each candidate’s figure. Color indicates the resulting reading frames as in b. Intensities represent ReFrame-calculated ratios from white (0%) to full-intensity magenta/green/black (100%) according to the resulting reading frame of the column. The annotated solid lines (first horizontal line top down) show the end of the non-mutated tumor samples (cutoff: 15%), while the dotted lines (second horizontal line top–down) mark the beginning of tumors being >50% mutated, associated with biallelic hits within the respective sample. Source data are available as a Source Data file. d Calculated mutation frequencies and mean allele ratios of most common indel mutation types (m3–p1) resulting from ReFrame analysis in ten representative cMS candidates sorted by length. %mut proportion of mutant tumors, %wt<0.5 proportion of tumors with biallelic hits. Columns m3–p1 display average frequencies of the respective indel mutations over all the samples tested.

