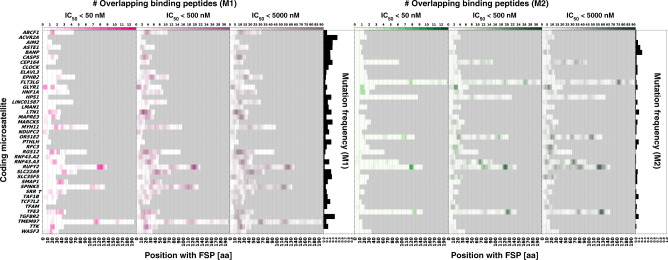
Fig. 3. MHC ligand predictions for a dataset of 82 analyzed frameshift peptides.
The figures display the predicted epitopes for the M1 and M2 frameshift peptides derived from all 41 cMS candidates over the length of the respective peptide. All epitopes predicted for three binding affinity thresholds (IC50 < 50 nM, IC50 < 500 nM, and IC50 < 5000 nM) are shown for the M1 frameshift peptides (left, magenta) and the M2 frameshift peptides (right, green). All candidates are sorted in alphabetical order with their respective frequency of mutation according to the ReFrame results. The gray field represents background and indicates C-terminal ends of the respective frameshift peptides.

