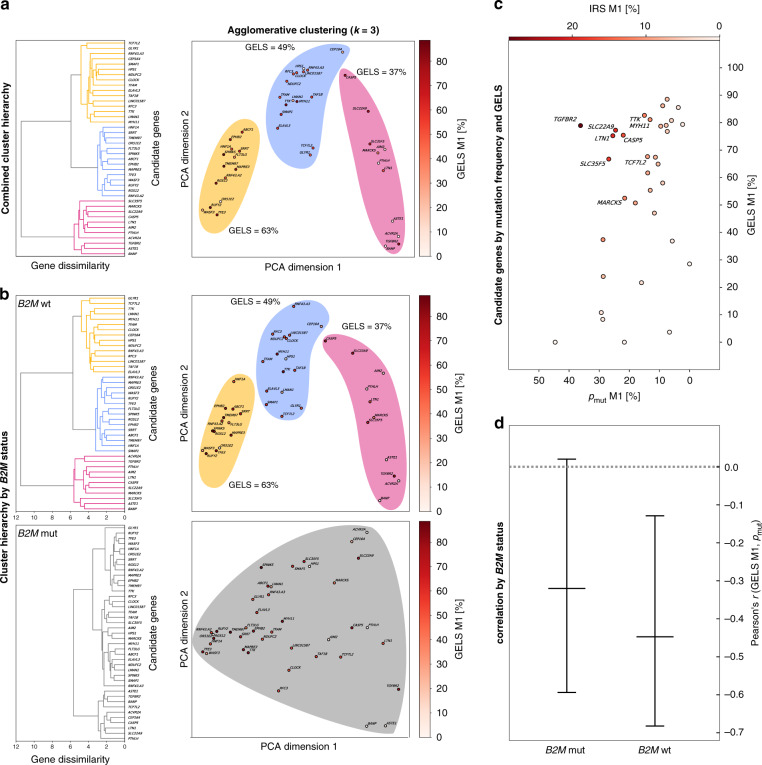
Fig. 4. Evidence of immune selection from cMS mutation patterns and GELS.
a Hierarchical clustering of cMS candidates on all tumor samples using frameshift abundance features. The full clustering hierarchy is displayed as a dendrogram, showing three clusters (yellow, blue, pink). The same clusters are visualized using RBF kernel PCA with two principal components and colored by their GELS. The three clusters display a trend in their mean GELS, with increasing values from pink to blue to yellow. b Hierarchical clustering of cMS on features split by B2M status, with wild type at the top and mutated at the bottom. The full hierarchy is displayed as a dendrogram for both feature sets. In contrast to B2M wild type, B2M-mutated features show no clustering at the computed clustering dissimilarity threshold of 5.7. The same data are again shown using RBF kernel PCA with two principal components. c Mutational frequency resulting from one base pair deletions (m1) is shown on the y axis against the GELS of the resulting M1 frameshift peptides (x axis). For GELS, all predicted epitopes (IC50 < 500 nM) were accounted for, with an assumed probability for a binder to be a true positive of pbinding = 50%. Every bubble represents one candidate. The gradient intensity of the bubbles shows IRS, with white color representing a low IRS, while dark red displays a high IRS. All candidates with an IRS of ≥10% are annotated. d Correlation between the number of predicted epitopes in cMS mutation-induced frameshift peptides and the frequency of the respective cMS mutations in MSI colorectal cancer separated by B2M mutation status. Pearson’s r is shown on the y axis, while the different groups of tumors are shown on the x axis. Centers indicate Pearson’s r, whiskers indicate 95% confidence intervals. A significant inverse correlation was observed showing r = −0.42, p = 0.0149 at n = 41 candidates for 99 MSI colorectal cancers with wild-type B2M, with a conservative estimate of predicted epitope fidelity of pbinding = 50%, indicating that high GELS was related to lower mutation frequency (for analysis of relative mutation frequencies, see also Supplementary Fig. 8).

