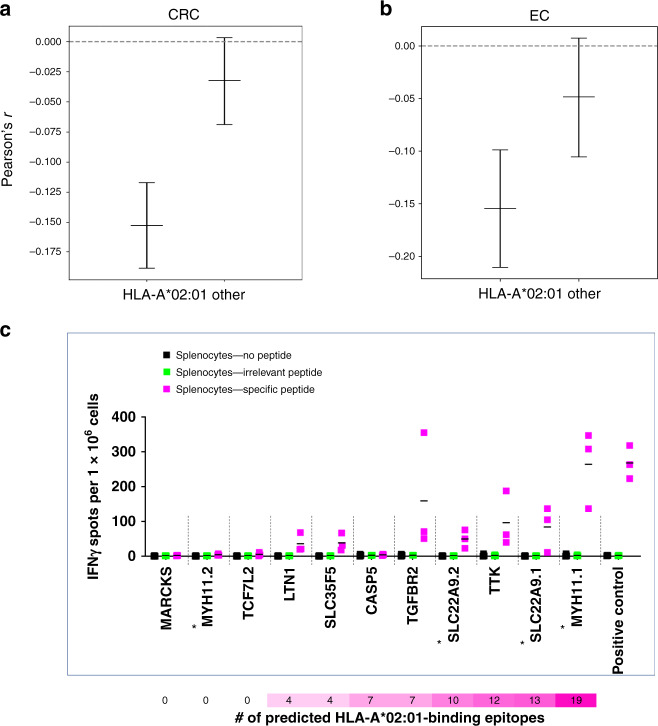
Fig. 5. HLA-A*02:01-specific analyses.
Correlation between the probability of at least one putative binder truly binding to HLA-A*02:01 within an M1 frameshift peptide and the respective M1 mutation rate in B2M-wild-type HLA-A*02:01-positive and HLA-A*02:01-negative CRC (a) and EC (b). The Pearson’s r from the correlation test is shown on the y axis, while the different groups of tumors are shown on the x axis. Centers indicate Pearson’s r, whiskers indicate 95% confidence intervals. A highly significant inverse correlation was observed showing r = −0.15, p = 4.4 × 10⁻¹⁶ at n = 34 HLA-A*02:01-positive CRCs with all parameters kept from Fig. 4d. For n = 37 HLA-A*02:01-negative CRCs (other), significance did not persist at p = 0.29. Similarly, a significant inverse correlation between HLA-A*02:01-binding scores and mutation frequency was detected for HLA-A*02:01-positive MSI EC (n = 13, r = −0.15, p = 0.00002) but not for HLA-A*02:01-negative MSI EC (n = 14) (see also Supplementary Fig. 8c, d). c Cellular immune response of M1 frameshift peptides in HLA-A*02:01-expressing A2.DR1 mice. IFNɣ ELISpot was performed with splenocytes from immunized A2.DR1 mice (n = 3) re-stimulated with the respective, specific M1 frameshift peptides LTN1, MARCKS, SLC22A9, SLC35F5, MYH11, TTK, TCF7L2, CASP5 (magenta), irrelevant peptide (green), or no peptide (black) as controls. Long frameshift peptides SLC22A9 and MYH were synthesized in two parts (split frameshift peptides are marked by asterisks), with the N-terminal peptide labeled 1 and the C-terminal peptide labeled 2. Each dot represents the number of IFNɣ spots per 1 × 10⁶ cells for one mouse. Mean values are indicated by horizontal lines. The M1 frameshift peptides are sorted according to the number of predicted HLA-A*02:01 ligands (IC50 < 500 nm). Source data are available as a Source Data file.

