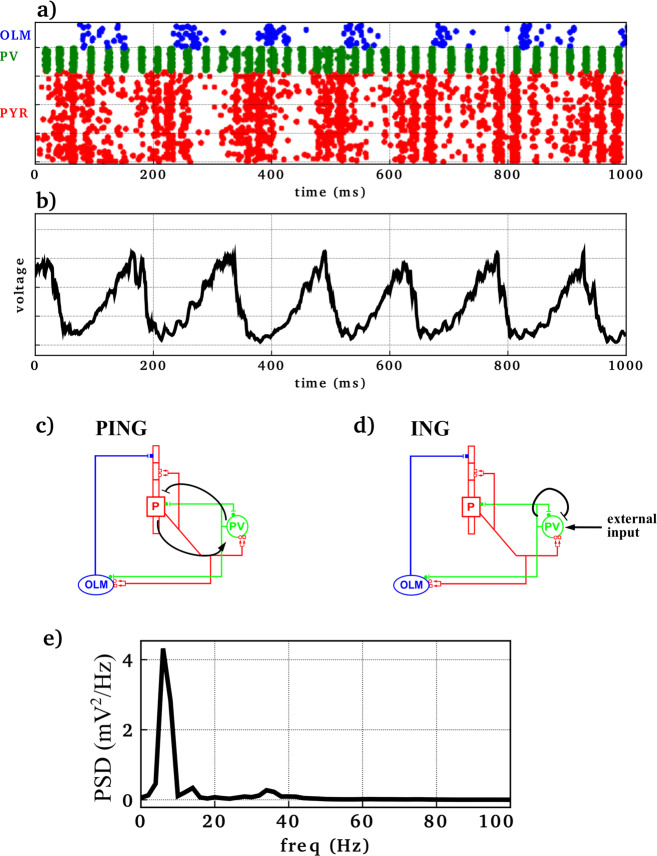
Fig. 1. Baseline simulation generated theta (6–8 Hz) with nested gamma (30–40 Hz) rhythm.
a Raster plot where each row represents a neuron and each dot represents an action potential (x-axis: time; y-axis: neuron identity; OLM interneurons in blue, PV basket interneurons in green, pyramidal neurons in red). b Simulated local field potential (LFP). c, d Simplified network diagrams showing mechanisms generating PING and ING oscillations. Arrows indicate activation while bar-headed lines represent inhibition. e Power spectral density (PSD) of LFP showed theta (~7 Hz) and gamma (30–40 Hz) peaks.

