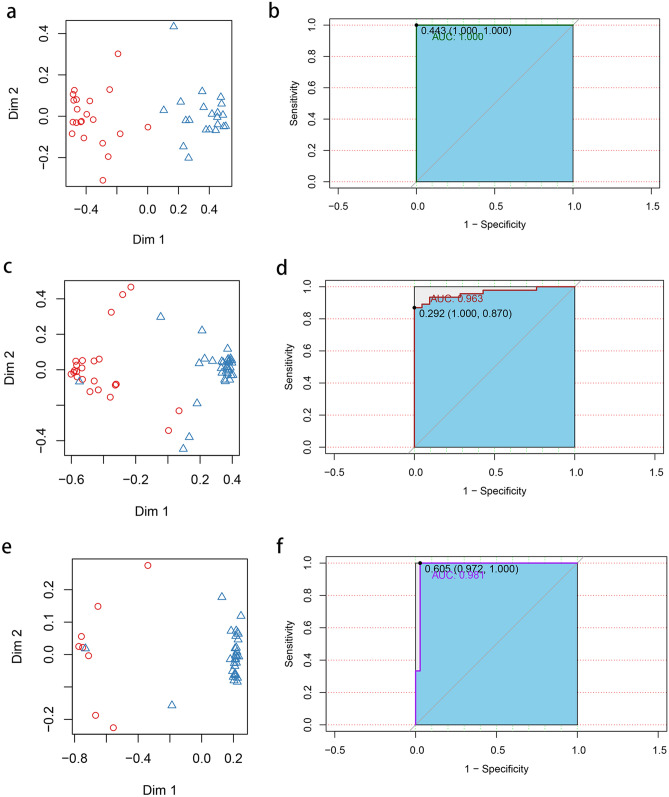
Figure 7.
Prediction performance of the random forest models. (a) Two-dimensional dot plot showing the distribution of the P group vs. the Health group. (b) ROC curve of the selected core microbiota in differentiating between the P group and the Health group. (c) Two-dimensional dot plot showing the distribution of the P group vs. the DAP group. (d) ROC curve of the selected core microbiota in differentiating between the P group and the DAP group. (e) Two-dimensional dot plot showing the distribution of the T2DM group vs. the DAP group. (f) ROC curve of the selected core microbiota in differentiating between the T2DM group and the DAP group.

