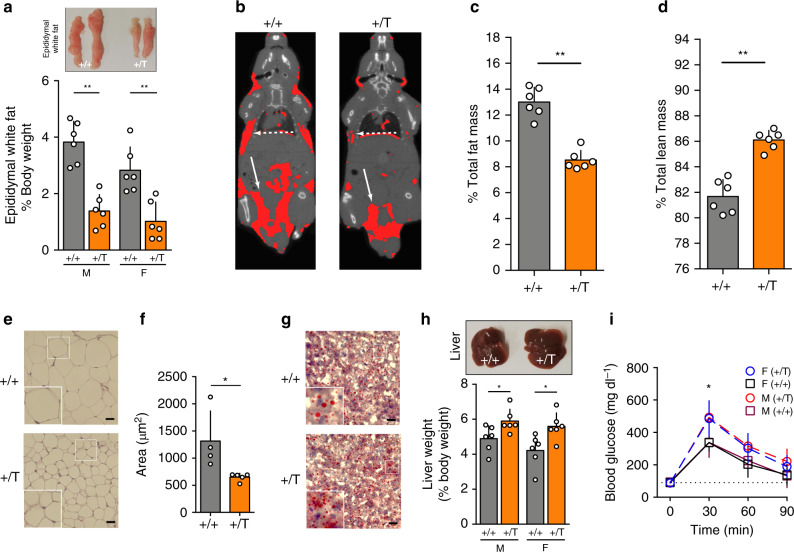
Fig. 2. GH/IGF-1 hypersecretion leads to alterations in GhrhrGpr101 mice body composition.
a Picture: Epididymal white fat from WT (+/+) and GhrhrGpr101 (+/T). Bars: quantification of epididymal white fat weight normalized to total body weight (n = 6 mice/group, p = 0.0022 for males and females). b Representative CT images segmented for fat of 27-week-old WT (+/+) and GhrhrGpr101 (+/T) mice (n = 6 mice per group). Total volume is in grayscale and fat volume is in red. Plain white arrows indicate subcutaneous fat and dashed arrows epididymal fat distribution. c Percentage of fat mass in WT (+/+) and GhrhrGpr101 (+/T) mice (n = 6 mice per group, p = 0.0022) determined by CT-scan analysis. d Percentage of lean mass in WT (+/+) and GhrhrGpr101 (+/T) mice (n = 6 mice per group, p = 0.0022) determined by CT-scan analysis. e 27-week-old WT (+/+) and GhrhrGpr101 (+/T) representative histological sections of epididymal adipose tissue stained with H&E. Scale bar: 30 µm. This experiment was repeated at least three times. f Mean adipocyte area, quantified using at least four fields per whole-slide image, from at least four animals per group (p = 0.0159). g Representative liver histological sections from 27-week-old WT (+/+) and GhrhrGpr101 (+/T) mice stained with ORO (n = 4 mice per group). Scale bars: 30 µm. h Picture: extracted livers from WT (+/+) and GhrhrGpr101 (+/T). Bars: quantification of liver weight normalized to body weight (n = 6 mice per group, males: p = 0.0303, females: p = 0.0130). i GTT of 11 month-old WT (+/+) and GhrhrGpr101 (+/T) mice. GTT was performed after 12 h of fasting. Glucose was injected IP to starved mice and blood was collected at indicated time points (0, 30, 60, and 90 min) to measure blood glucose levels (males: n = 6 mice per group, females: n = 5 mice per group). 0 min: p = 0.5173 for males and p = 0.7302 for females. 30 min: p = 0.0260 for males and p = 0.0317 for females. 60 min: p = 0.1970 for males and p = 0.0952 for females. 90 min: p = 0.1320 for males and p = 0.4206 for females. All data are presented as Mean ± S.D. For statistical analysis of all data, a two-sided Mann–Whitney test was used. ns not significantly different; *p < 0.05; **p < 0.01; ***p < 0.001. F Female, M Male.

