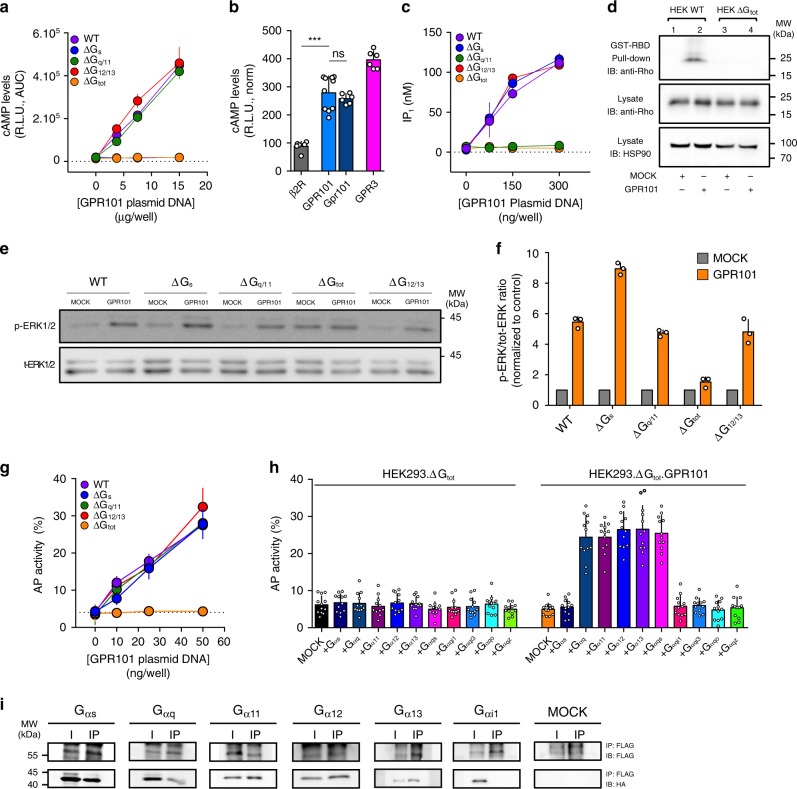
Fig. 4. GPR101 is constitutively coupled to Gs, Gq/11, and G12/13.
a Measurement of cAMP levels after GPR101 transient transfection in HEK293 WT, ΔGs, ΔGq/11, ΔG12/13, or ΔGtot. n = 12 independent experiments. b Comparison of constitutive cAMP levels obtained after transient transfection of pGlo.HEK293 with the indicated receptors: ß2AR (n = 6 independent experiments), GPR101 (n = 10 independent experiments), Gpr101 (n = 6 independent experiments), and GPR3 (n = 6 independent experiments). The values have been normalized to receptor expression to enable direct comparison. GPR101 vs ß2AR: p = 0.0002; GPR101 vs Gpr101: p = 0.5622. c Measurement of IP1 levels after transient GPR101 transfection in HEK293 WT, ΔGs, ΔGq/11, ΔG12/13, or ΔGtot. n = 4 independent experiments. d Activated Rho was detected in lysates of HEK293 WT or HEK293ΔGtot transiently transfected with GPR101 following precipitation with GST-Rho-binding domain (RBD). Shown are representative of at least three independent experiments. See text for details. e Shown are pictures of immunoblots for the determination of ERK1/2 phosphorylation in WT HEK293 or HEK293 cells deficient for the indicated G proteins and transiently transfected with GPR101 or empty vector (MOCK). f Immunoblots were quantified by densitometric analysis. The p-ERK1/2 to total ERK1/2 ratio has been normalized to the MOCK condition. n = 3 independent experiments. g TGF α Shedding assay performed on HEK293 WT, ΔGs, ΔGq/11, ΔG12/13, or ΔGtot transiently transfected with GPR101. Results are expressed as the percentage of AP activity in the conditioned medium. n = 12 independent experiments. h TGF α shedding assay in HEK293 ΔGtot transiently transfected with empty vector (MOCK) or GPR101 alone or together with various Gα proteins and chimeric Gα proteins. Results are expressed as the percentage of AP activity in the conditioned medium. n = 12 independent experiments. i Co-Immunoprecipitation of FLAG-GPR101 with Anti-FLAG beads followed by immunodetection of HA-tagged Gα proteins with anti-HA antibody on WB membranes. Full scans of blots from d, e, and i can be found in the Source Data File. All data are Mean ± S.D. AUC area under curve, HSP90 heat shock protein 90. IB antibody used for blotted membrane, I input, IP immunoprecipitated fraction. Shown are representative pictures of three independent experiments. R.L.U. Relative Luminescence Unit. For statistical analysis of all data, a two-sided Mann–Whitney test was used. ns not significantly different; *p < 0.05; **p < 0.01; ***p < 0.001.

