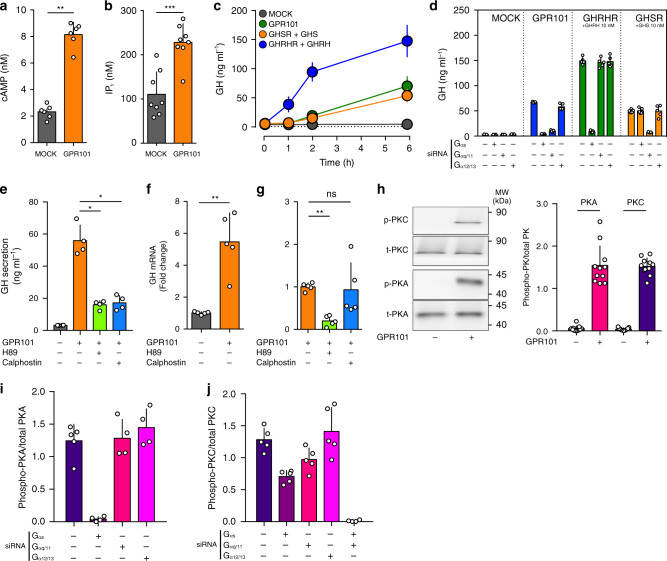
Fig. 5. GPR101 promotes GH secretion through Gs and Gq/11.
All the experiments presented here were performed on the GH3 pituitary cell line. a Determination of cAMP levels (by ELISA) following transient transfection with MOCK or GPR101 plasmid (p = 0.0022). b Determination of IP1 levels (by ELISA) following transient transfection with MOCK or GPR101 plasmid (p = 0.0006). c Time-dependent (0, 1, 2, and 6H) measurement (by ELISA) of GH secretion in the cell culture supernatant. The cells were transfected with MOCK (dark grey), GPR101 (green), GHSR (orange), or GHRHR (blue) for 24 h, then starved for 3 h. For GHSR and GHRHR, cells were stimulated with their respective ligands (GHS or GHRH, 10 nM). GPR101 and MOCK received a vehicle treatment as control. d GH determination in the cell culture supernatant after 24h-treatment with various siRNAs (Gαs, Gαq/11, or Gα12/13), 24h-transfection with expression plasmids containing receptors (MOCK, GPR101, GHSR, or GHRHR), 3h-starvation and 6h-stimulation with indicated agonists (GHS or GHRH, 10 nM). e GH secretion was determined (by ELISA) in the cell culture supernatant following transfection with GPR101 (or MOCK) and treated with vehicle, H89 (10 µM, p = 0.0286) or Calphostin (10 µM, p = 0.0286). f, g Rat GH mRNA determination by RT-qPCR following transfection with MOCK or GPR101 (p = 0.0079) (f) and treatment with PKA & PKC inhibitors H89 (10 µM, p = 0.0079) and Calphostin (10 µM, p = 0.6905) (g), respectively. h Left: Immunoblot for the detection of phosphorylated PKA and PKC in GH3 cells following transfection with MOCK or GPR101. Right: Quantification by densitometry of immunoblots. Normalization was performed compared to total PKA and PKC proteins in cell lysate. Full scans of blots are available in the Source Data file. I, j Quantification by densitometry of immunoblots for PKA and PKC in the presence of GPR101 and different siRNAs. The antiphosphorylated antibody has been normalized to the signal from the antibody against total protein. All data are Mean ± S.D. of n = 8 (b), n = 6 (a, c), n = 5 (d, f, g, j), n = 4 (e, i), and n = 3 (h) independent experiments. For statistical analysis of all data, a two-sided Mann–Whitney test was used. ns not significantly different; *p < 0.05; **p < 0.01; ***p < 0.001.

