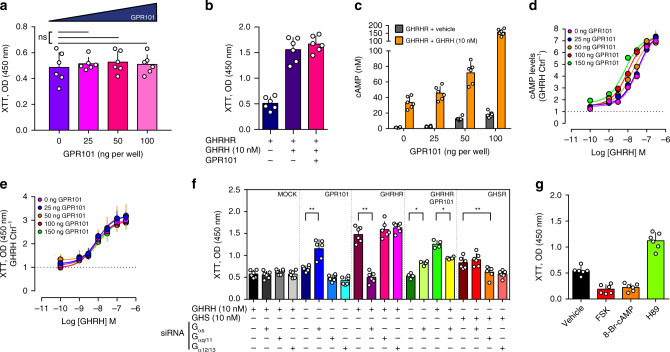
Fig. 6. GPR101 does not increase GH3 cell proliferation.
a Proliferation was measured with XTT cell proliferation kit on GH3 cells transiently transfected with increasing amounts (0, 25, 50, and 100 ng) of pcDNA3.1 FLAG-GPR101 plasmid (0 ng vs 25 ng p = 0.8182; vs 50 ng p = 0.5887; vs 100 ng p = 0.6991). b Quantification of proliferation (by using the XTT reagent) of GH3 cells co-transfected with GHRHR and GPR101 (or MOCK) and treated with vehicle or GHRH at final concentration of 10 nM. c Comparison of cAMP levels (measured by ELISA) in GH3 cells transfected with GHRHR (100 ng) in the presence of increasing amounts (0, 25, 50, and 100 ng) of GPR101 plasmids, and treated with vehicle (dark grey) or GHRH (10 nM, orange). d, e GH3 cells transfected with GHRHR (100 ng) and increasing amounts of FLAG-GPR101. The cells were treated with increasing concentration of GHRH. d cAMP levels measured by ELISA and normalized to vehicle condition. e Proliferation measured with XTT assay. f Effect of the siRNA-mediated depletion of different G protein α subunits (Gαs, Gαq/11, or Gα12/13) on GH3 proliferation measured Briefly, GH3 cells were incubated with siRNAs (Gαs, Gαq/11, or Gα12/13, at a final concentration of 1 µM) for 24 h, and then transfected with MOCK, GPR101 (NTS vs Gαs p = 0.0022), GHRHR (NTS vs Gαs p = 0.0022), GPR101+GHRHR (untreated NTS vs Gαs p = 0.0286, GHRH-treated NTS vs Gαs p = 0.0286) or GHSR (GHS-treated NTS vs Gαq/11 p = 0.0065). GHRHR- and GPR101+GHRHR-transfected cells were stimulated with GHRH (10 nM) and GHSR-transfected cells with GHS (10 nM). g Determination of the proliferation of GPR101-transfected GH3 cells treated with vehicle or different pharmacological agents, such as FSK (adenylate cyclase activator, 10 µM), 8-Br-cAMP (PKA activator, 10 µM), and H89 (PKA inhibitor, 10 µM). All data are Mean ± S.D. of n = 6 independent experiments (except for the co-transfection of GHRHR with GPR101 in panel f and for experiments of panels d, e where n = 4). For statistical analysis of all data, a two-sided Mann–Whitney test was used. ns not significantly different; *p < 0.05; **p < 0.01; ***p < 0.001.

