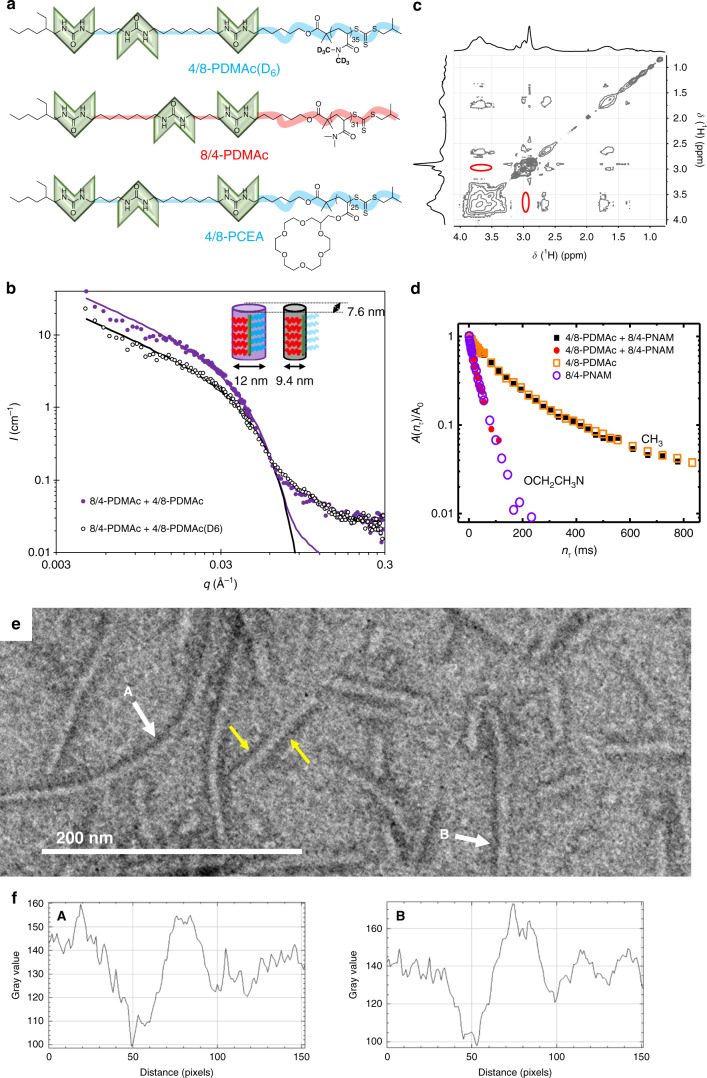
Fig. 2. Local segregation.
a Structure of 4/8-PDMAc(D6), 8/4-PDMAc and 4/8-PCEA. b SANS data of equimolar co-assemblies in D2O (freeze-dried particles, 10 g L−1). The curves are fits with the form factor of cylinders of elliptical cross-section that have the same homogeneous contrast. Dimensions of the cross-sections are indicated on the inset (The discrepancy between the model and the experiment at high q is due to the fact that the solvated polymer chains at the surface of the objects are not explicitly taken into account by the form factor of a simple cylinder). c 1H NOESY NMR contour plot of (4/8-PDMAc + 8/4-PNAM) equimolar mixture in D2O (freeze-dried particles, 5 g L−1). The red ellipses highlight the absence of cross-relaxation peaks between the PDMAc and PNAM chains (compare to Supplementary Fig. 27). d Normalized 1H transverse relaxation signal A(t)/A0 of the PDMAc CH3 protons (squares) and the PNAM OCH2CH2N protons (circles) in the (4/8-PDMAc + 8/4-PNAM) equimolar mixture (solid symbols) or in the pristine polymer (hollow symbols) (1 g L−1 in D2O, obtained by dialysis). e TEM of (4/8-PCEA + 8/4-PDMAc) equimolar mixture (negative staining). White arrows highlight the PCEA-side of some Janus nanorods. Yellow arrows highlight contrast inversion along the nanorods axis. f Gray scale analysis of marked rods in (e). See Supplementary Figs. 30 and 31 for more data and control experiment.

