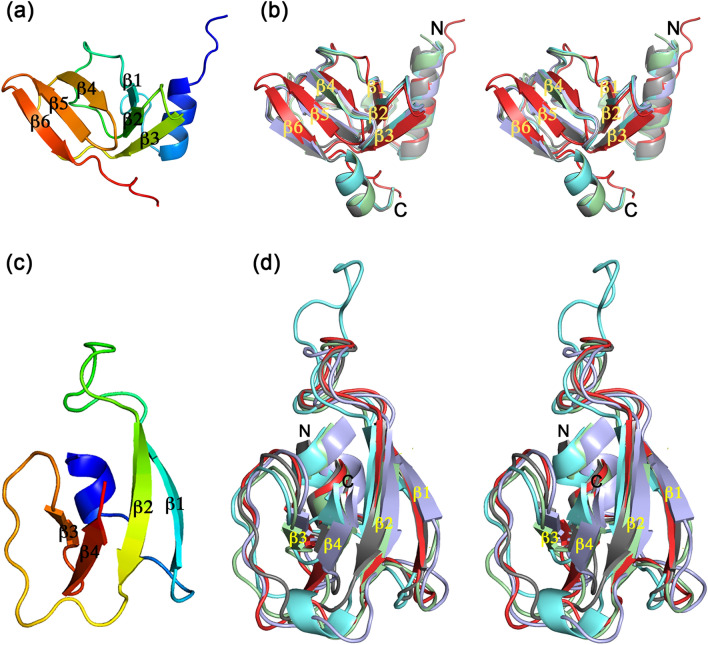
Figure 4.
TSP2 D1 and D3′ folds. (a) Cartoon representation of D1 with rainbow coloring from the N-terminus (blue) to the C-terminus (red). (b) Stereoscopic view of superimposed D1 fold modules of TSP2 (red; residues q66-247), TSP4 (gray; residues 340–421 PDB entry 5W6H)), TSP1 (green; residues 12–96, PDB entry code 4OJ5), TSP3 (light blue; residues 12–95, PDB entry 6NW9), and TSP gp63.1 from E. coli 4 s G7C phage (cyan; residues 13–96, PDB entry 4QNL). (c) Cartoon representation of the D3′ with rainbow coloring from the N-terminus (blue) to the C-terminus (red). (d) Stereoscopic view of superimposed D3′ of TSP2 (red; residues 270–328), TSP4 (gray; residues 503–557 PDB entry 5W6H), TSP gp49 from A. baumannii phage Fri1 (green; residues 209–269, PDB entry 6C72), TSP from A. baumannii phage AM24 (light blue; residues 37–96, PDB entry 5W5P), TSP gp42 from A. baumannii phage vb_AbaP_AS12 (cyan; residues 23–82, PDB entry 6EU4). The figure was generated using the computer program PyMol v1.8.0.2 (Schrödinger, LLC, https://www.pymol.org).

