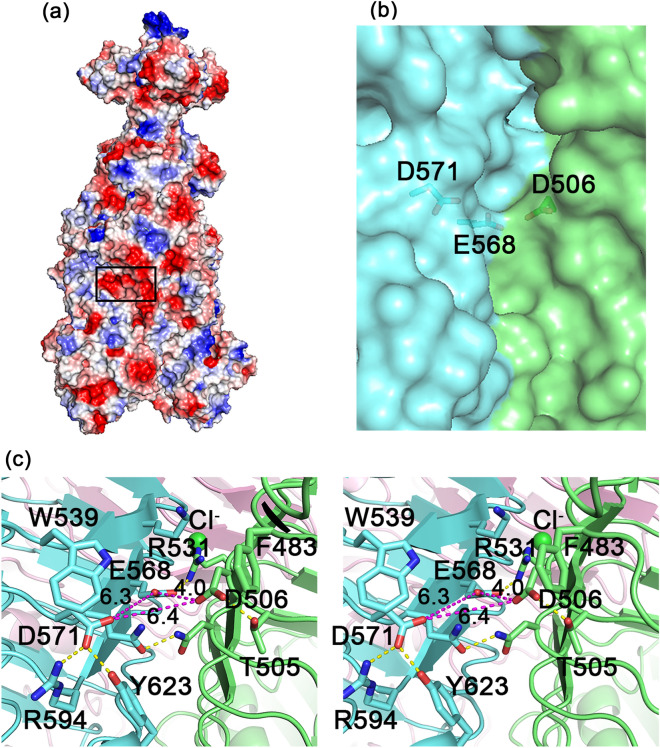
Figure 7.
The active site of TSP2. (a) Surface vacuum electrostatics of the TSP2 trimer, indicating the location of the active site (rectangular black box). Negatively polar regions are colored red and positively polar region are colored blue. The overall polarity of the active site is negative. (b) The partially transparent molecular surface at the active site, highlighting key active site residues. As can be seen, the interface between the green and cyan molecules forms a cleft. The trimer contains three such clefts at the three subunit interfaces. (c) Stereoscopic representation of active site residues. The distances between the three carboxyl groups of Asp506, Asp571, and Glu578, the candidate catalytic resides that were probed by site-directed mutagenesis, are shown in magenta dash lines. Key salt bridges and hydrogen bond interactions are shown in yellow dash lines. Aromatic groups may interact with the substrate pyranose rings. The chloride bound underneath the active site is shown as green sphere. The trimer subunits are colored differently. The figure was generated using the computer program PyMol v1.8.0.2 (Schrödinger, LLC, https://www.pymol.org).

