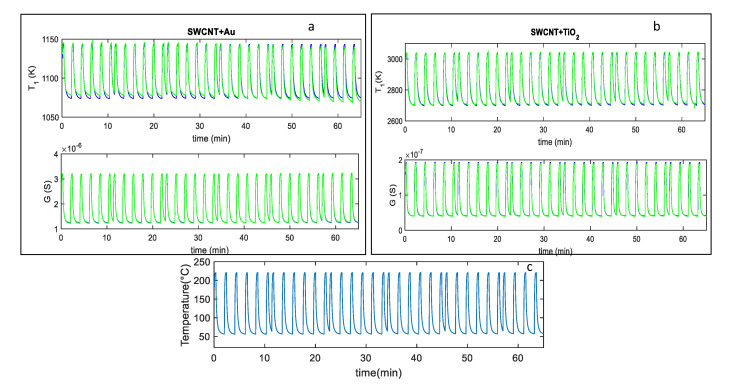
Figure 5.
(a,b): Blue line-fitting results obtained after parameter estimation for the SWCNT-Au decorated samples (a), and the SWCNT-TiO2 decorated samples (b); green lines-measured values; the top plot reports the behavior of the parameter whereas the bottom one reports the sensor response G vs. time. The reported results refer to measurements performed in dry synthetic air for approximately 65 min with the temperature profile shown in (c). (c) measured temperature profile, obtained by repeatedly heating at 220 °C for approximately 0.3 min, and at 60 °C for 1.6 min, respectively (total temperature pulse period tp ≈ 2 min).

