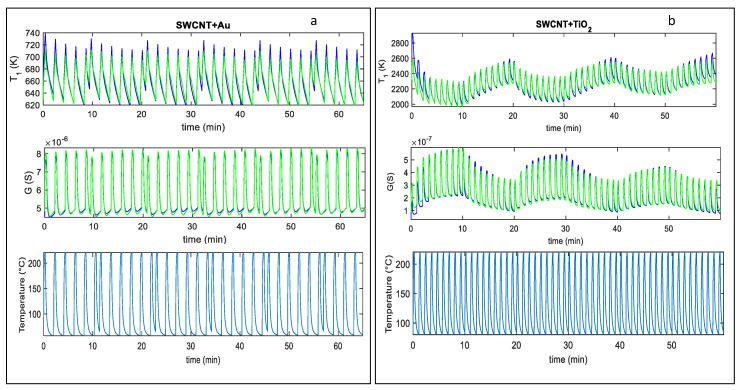
Figure 6.
Fitting results obtained after parameter estimation for and G vs. time. (a), top two plots: Blue line-fitting results for the SWCNT-Au decorated sample, green lines-measured value; measurements obtained in a constant flow (200 mL/min) of air and 25 ppm NO2. (a), lower plot: Measured temperature profile, obtained by repeatedly heating at 220 °C for approximately 0.3 min, and at 60 °C for 1.6 min, respectively (total temperature pulse period tp ≈ 2 min). (b), top two plots: Blue line-fitting results obtained for the SWCNT-TiO2 decorated sample, green lines-measured value; measurements obtained at constant flow (200 mL/min) with the following protocol: 10 min: air + 37 ppm NO2; 10 min: air; 10 min: air + 25 ppm NO2; 10 min: air; 10 min: air + 12 ppm NO2; 10 min: air. (b), lower plot: Measured temperature profile, obtained by repeatedly heating at 220 °C for approximately 0.2 min, and at 60 °C for 0.8 min, respectively (total temperature pulse period tp ≈ 1 min).

