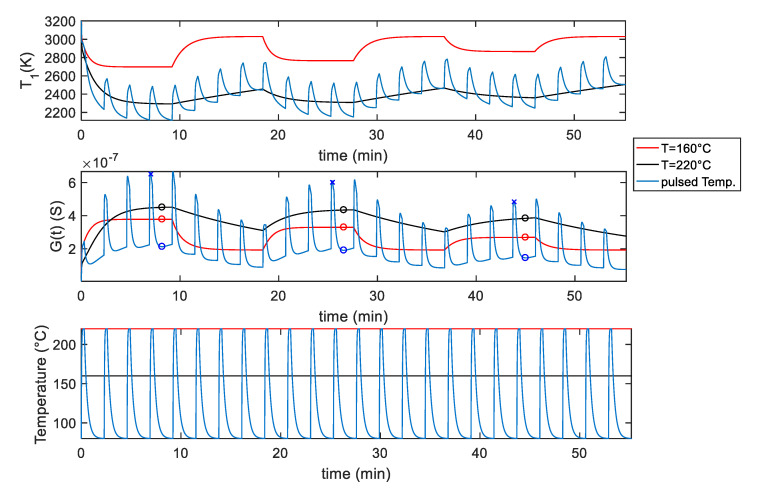
Figure 8.
Simulation results for the G and T1 behavior for the SWCNT-TiO2 decorated sensor sample, assuming the temperature profiles shown in the bottom plot of the figure. The measurement gas profile is as follow: 9.2 min carrier gas + 37 ppm NO2, 9.2 min carrier gas, 9.2 min carrier gas + 25 ppm NO2, 9.2 min carrier gas, 9.2 min carrier gas + 12 ppm NO2, 9.2 min carrier gas, related temperature as per legend. For the markers, see Figure 9.

