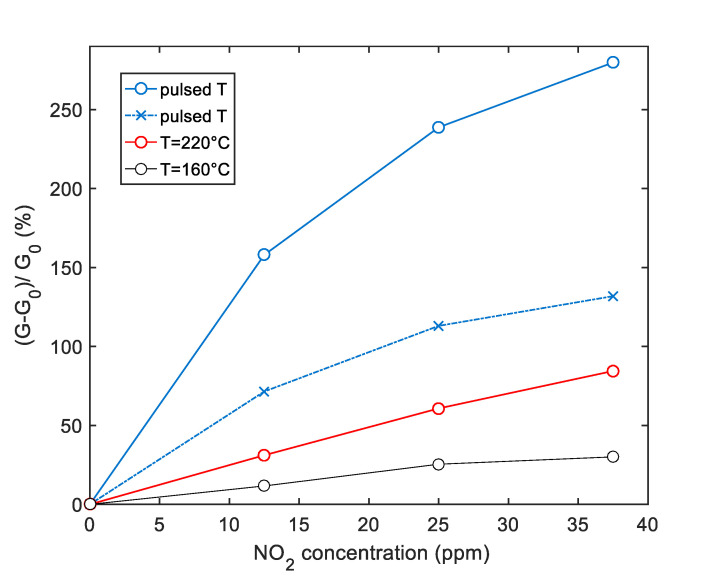
Figure 9.
Simulated response of the sensor decorated with TiO2 to NO2 as a function of the NO2 concentration according to the selected temperature profile (shown in Figure 8). ×-blue markers: Results obtained by sampling the sensor response at the end of the last Thigh pulse of each NO2 injection phase. O-blue markers: Results obtained by sampling the sensor response at the end of the last Tlow pulse of each NO2 injection phase, as shown in Figure 8. Red and black lines are the responses obtained at the end of each injection phase at a constant temperature as per legend.

