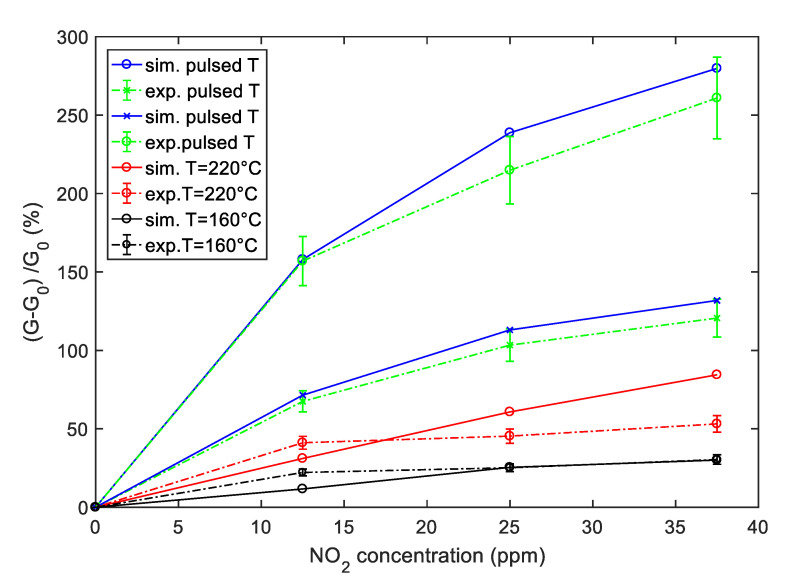
Figure 15.
Simulation (solid lines) and experimental results (dashed lines) of the sensor response to NO2 as a function of the NO2 concentration for the SWCNT-TiO2 sample. Blue color—sensor response obtained with pulsed temperature measurement profile; red color—sensor response with a constant temperature at 220 °C, black color—sensor response with a constant temperature at 160 °C as in Figure 8; the error bars refer to the estimated repeatability (approximately 10% of the response value).

