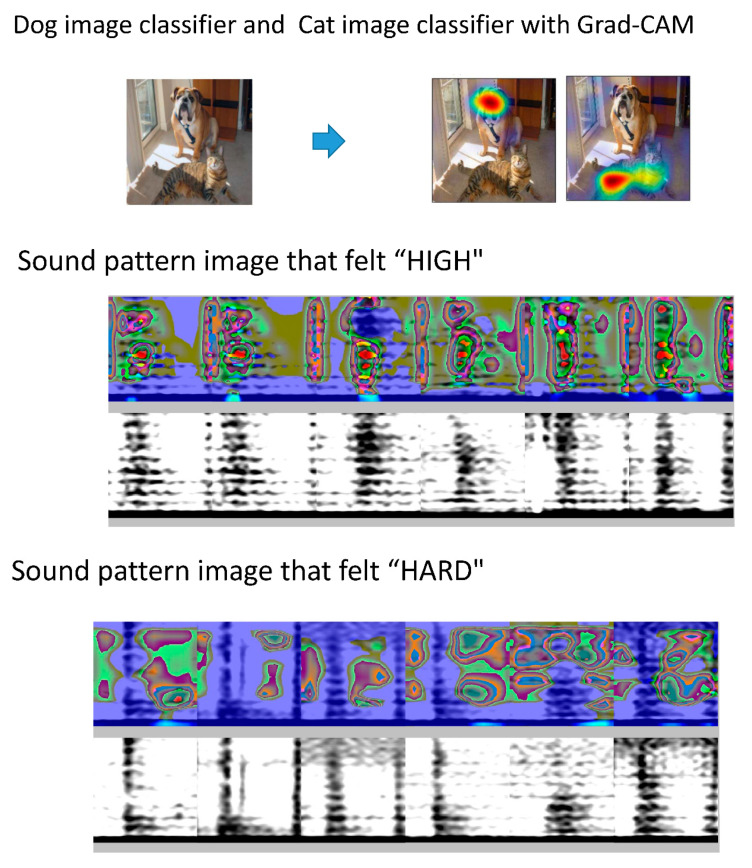
Figure 6.
Grad-CAM for visualization of characteristic sites. With Grad-CAM, if the image is judged to be a dog using a dog image classifier, the image is colored. The same applies to a cat image classifier. When the characteristic portion of the sound pattern image that felt “high” is visualized, the 250–750 Hz region in the systole is emphasized in the heat map. In the case of a sound pattern image that felt “hard,” the silent region in the diastolic area was emphasized.

