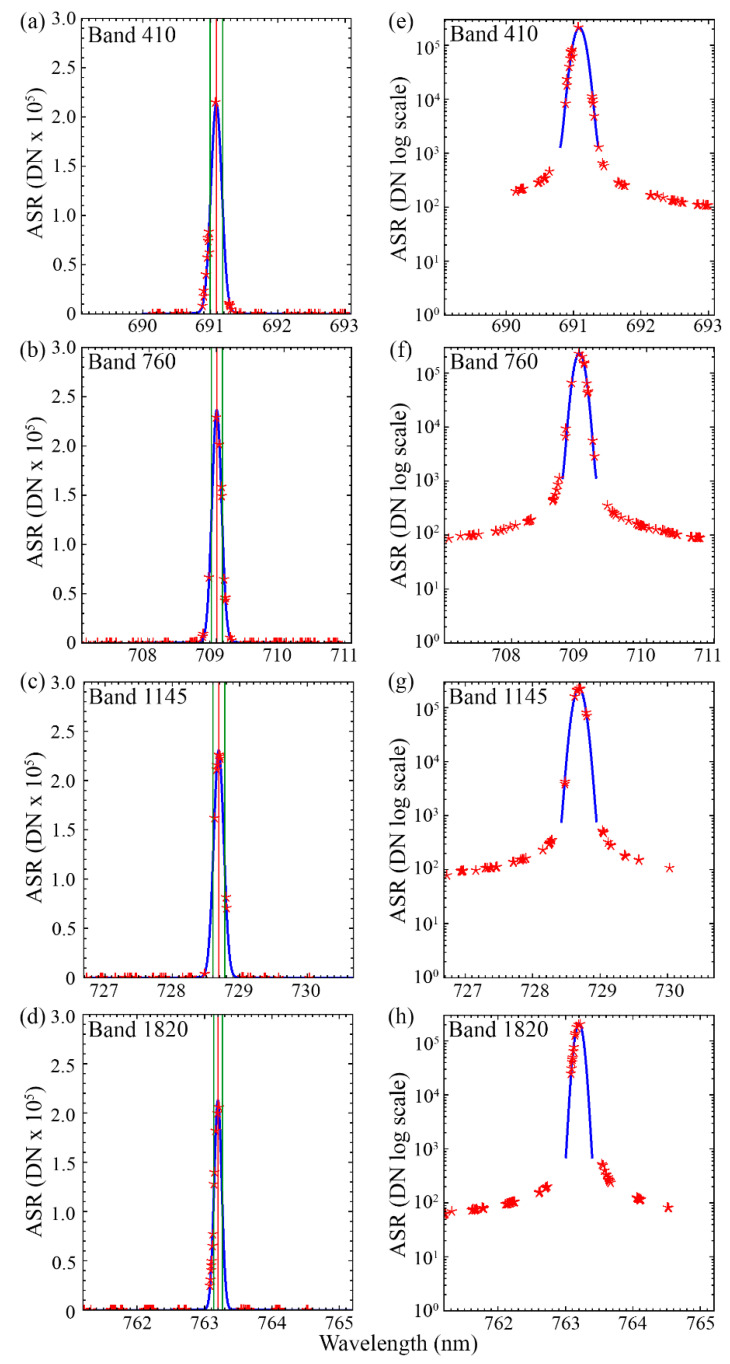
Figure 4.
Examples of absolute spectral response (ASR) functions for several FIREFLY bands. The actual observations (red stars) are interpolated with a Gaussian function (blue line) to calculate the full-width at half maximum (FWHM) (green lines) for the band center (red line). The full observations are shown in panels (a–d) for the band numbers stated in the panels. The fit of the function to the peak of the observations for the same bands are shown in panels (e–h).

