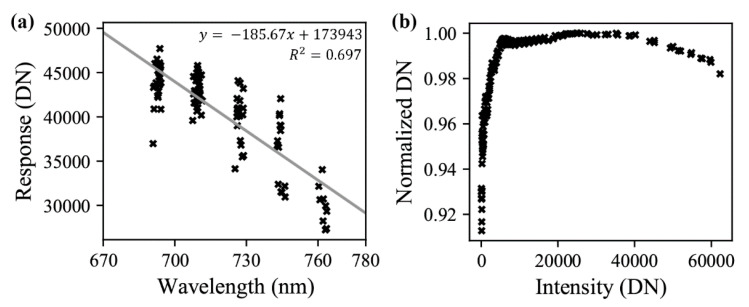
Figure 7.
(a) The relationship between FIREFLY response and wavelength (gray line), established by GLAMR observations (black x); (b) the relationship between normalized digital numbers (DN) and intensity DN used to establish the detector non-linearity, as measured with the GLMR integrating sphere monitors and ASD (black x).

