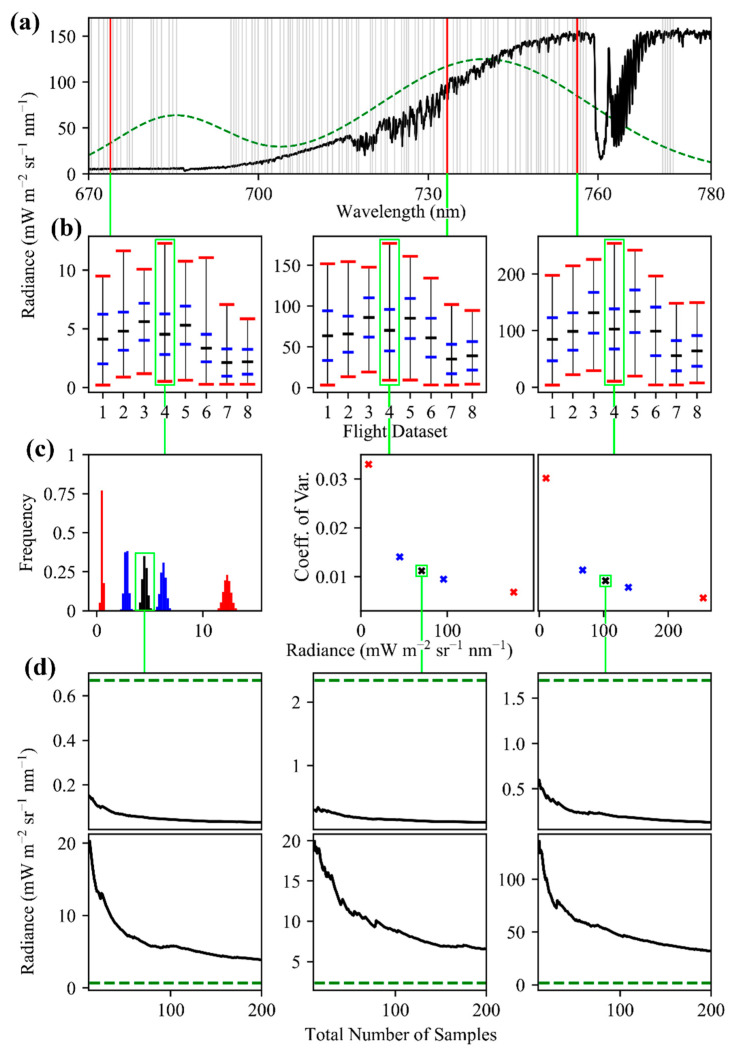
Figure 21.
(a) Absorption features (gray lines) shown with a FIREFLY vegetation spectra (black line), and a simulated SIF function (green dashed line, not to scale). (b) Radiances from in-flight acquisitions (see Appendix A Table A2) for the valley bands of the features shown as red lines in (a). The radiance range (vertical black line), mean (horizontal black line), ± one standard deviation (blue lines), and minimum and maximum (red lines) are shown. (c) The frequency (left) and coefficient of variation (middle and right) of radiances for Monte Carlo simulation (100,000 samples) of noise distributions centered on the key values of the radiance ranges outlined in green in (b). Colors match those of the mean, minimum etc., in (b). (d) The 95% confidence intervals on the mean for the values outlined in green in (c), over the accumulation of samples from the Monte Carlo simulation. Direct retrievals from the valley bands (top row) and indirect retrievals (bottom row) are shown, along with expected SIF radiance (dashed green lines) based on the SIF function in Figure 1.

