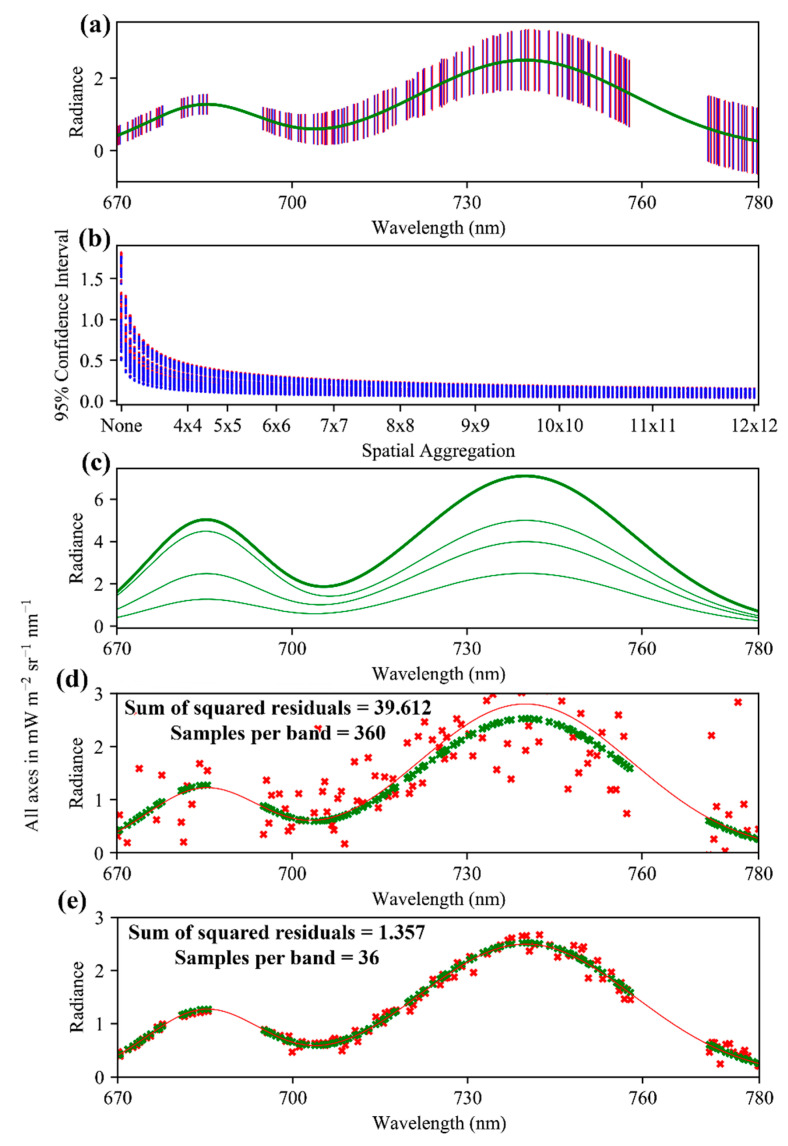
Figure 22.
(a) Expected variation in valleys (red lines) and peaks (blue lines) relative to a simulated SIF signal (green line); (b) expected confidence intervals for valleys (red dots) and peaks (blue dots) at different spatial aggregation factors (functionally, sample sizes); (c) example simulated SIF functions (thin green lines) and their sum (thick green line); (d) indirect SIF retrievals (red x) fitted to a SIF signal (red line). The true SIF value in each band (green x) is also shown. Note that the vertical axis matches the range of (e) for the sake of comparing the fitted functions, and therefore does not show all of the residuals; and (e) direct SIF retrievals from valleys (red x) fitted to a SIF signal (red line). The true SIF value in each band (green x) is also shown.

