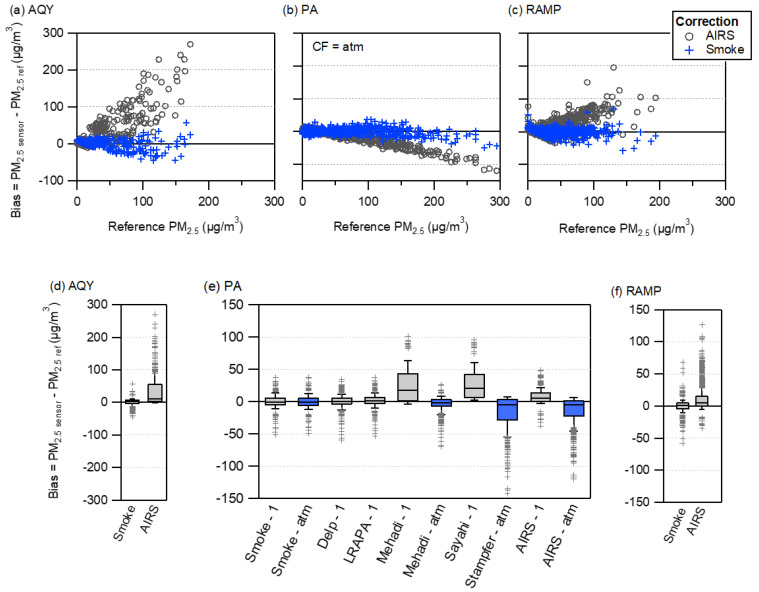
Figure 3.
Bias for the AIRS ambient and smoke corrected sensor measurements for the (a) AQY (b) PA and (c) RAMP. Box plots of the hourly bias values for different correction equations for the (d) AQY (e) PA and (f) RAMP. ‘Smoke’ correction is from all smoke impacted sites, ‘AIRS’ correction is for ambient in NC, PA corrections from the literature are from smoke impacted Delp and Singer [23], Lane Regional Air Programs Association (LRAPA) [31], Mehadi et al. [7], Sayahi et al. [8], and Stampfer et al. [32]. ‘-1’ and ‘-atm’ refer to the data source the correction was applied to and was based off current understanding of the data source used to generate each correction.

