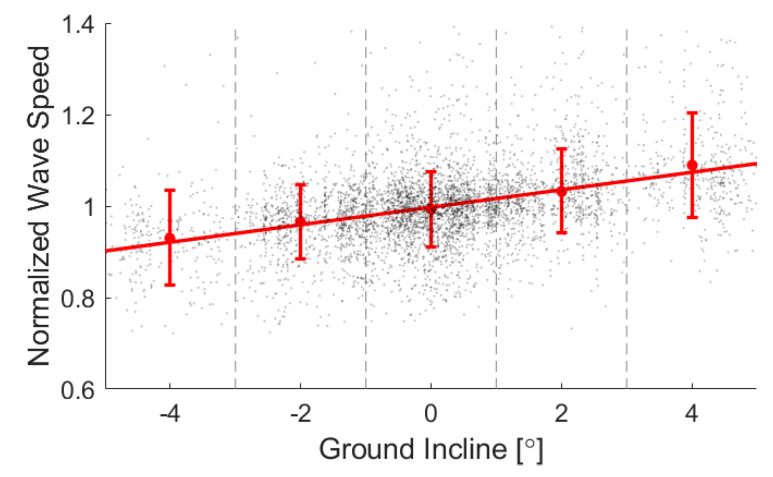
Figure 5.
A regression of peak loading against ground incline yielded a positive association (p < 10−6). Means and standard deviations for each binned incline demonstrate the trend, while the spread of data shows the remaining variability in the data. Regression results for individual subjects are shown in Appendix B.

