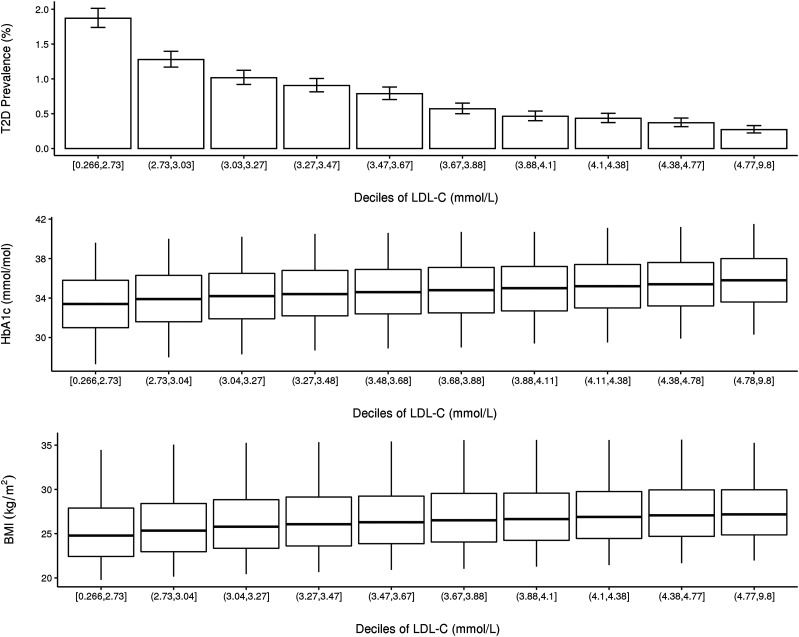
Figure 1.
T2D prevalence, HbA1c, and BMI by circulating LDL-C deciles in the UK Biobank. T2D prevalence is shown as a percentage, with error bars corresponding to the Clopper-Pearson CI. Whisker plots show the median value (horizontal line in box), the 25th and 75th percentile delimited by the box, and the vertical lines extending to the 5th and 95th percentile.

