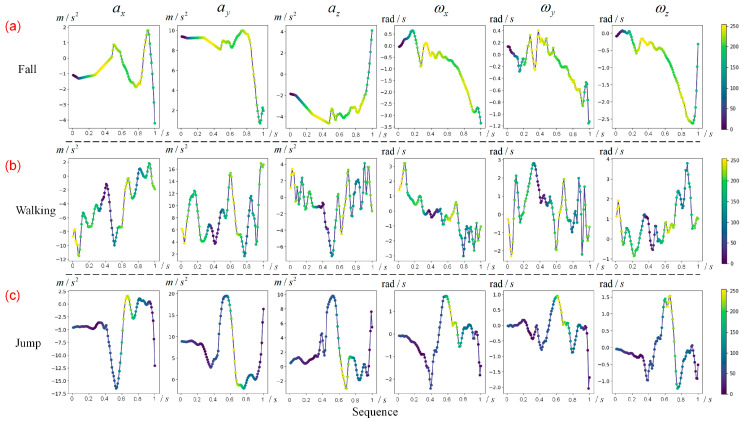
Figure 5.
The hot map of four samples of the MobiAct dataset. The color bar indicates the importance of regions in the sequence for classification. , , and represent x-axis, y-axis, and z-axis of acceleration, respectively. , , and represent x-axis, y-axis, and z-axis of angular velocity, respectively. (a) One fall sample. (b) One walking sample. (c) One jump sample.

