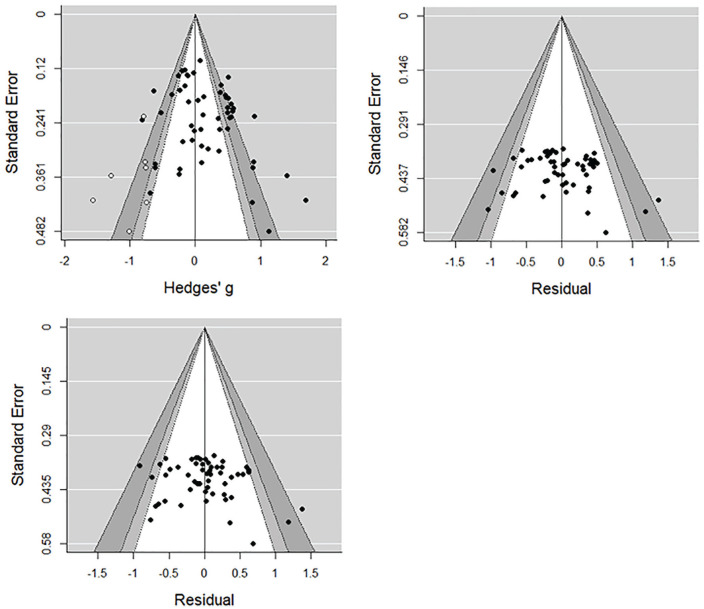
Figure 4.
Contour-enhanced funnel plots for the overall victim derogation effect model (left panel), and mixed-effects models including emotional impact (center panel) and year of publication (right panel) as moderators.
Note. Shaded areas represent regions of statistical significance (white—p > .10; light gray—p = .10–.05; dark gray—p = .05–.01; plot exterior—p < .01). White data points on the overall model plot (left panel) indicate effects imputed via trim-and-fill analyses.

