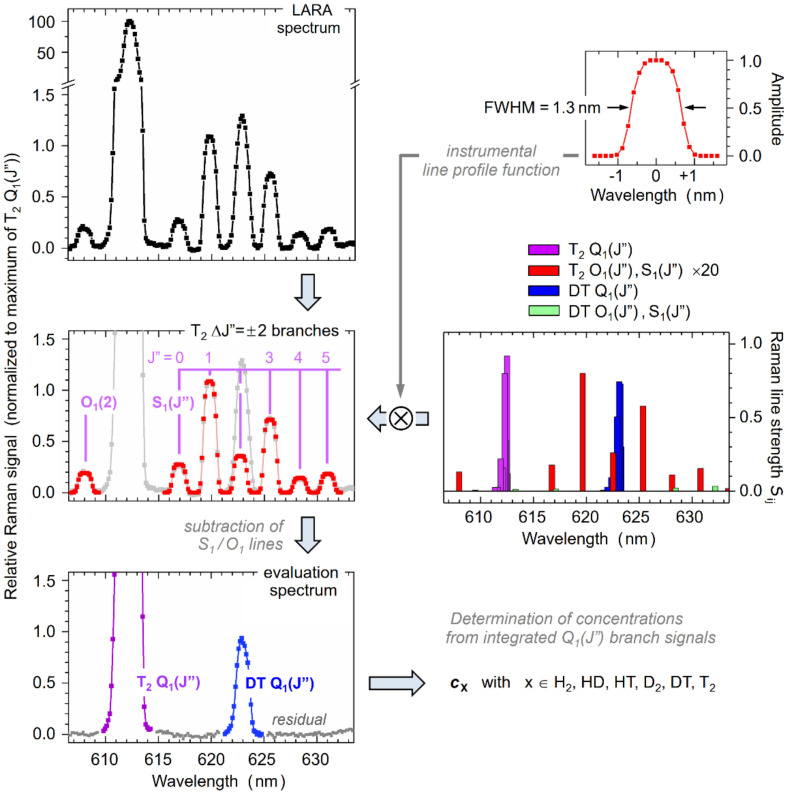
Figure 5.
Deconvolution of spectral overlapping, exemplified for the determination of exact T2/DT concentrations in the KNM1 gas mixture. Top-left—segment of the spectrum in Figure 3c (the scale is split, to visualize all spectral features; center-left—theoretical O1(J″)/S1(J″) lines for T2, overlaid on the experimental spectrum, with the individual Raman lines annotated; bottom-left—spectrum with the O1(J″)/S1(J″) lines subtracted, leaving only the Q1(J″)-branches to evaluate species concentrations. Top-right—experimental line profile function, derived using ShapeFit; center-right—theoretical Raman line strengths φij for the O1(J″)/Q1(J″)/S1(J″) lines of T2 and DT, calculated for a gas temperature of T = 298 ± 2 K. Note that the values for the O1(J″)/S1(J″) lines of T2 are scaled by ×20, to emphasize the overlap between T2 S1(2) and DT Q1(J”).

