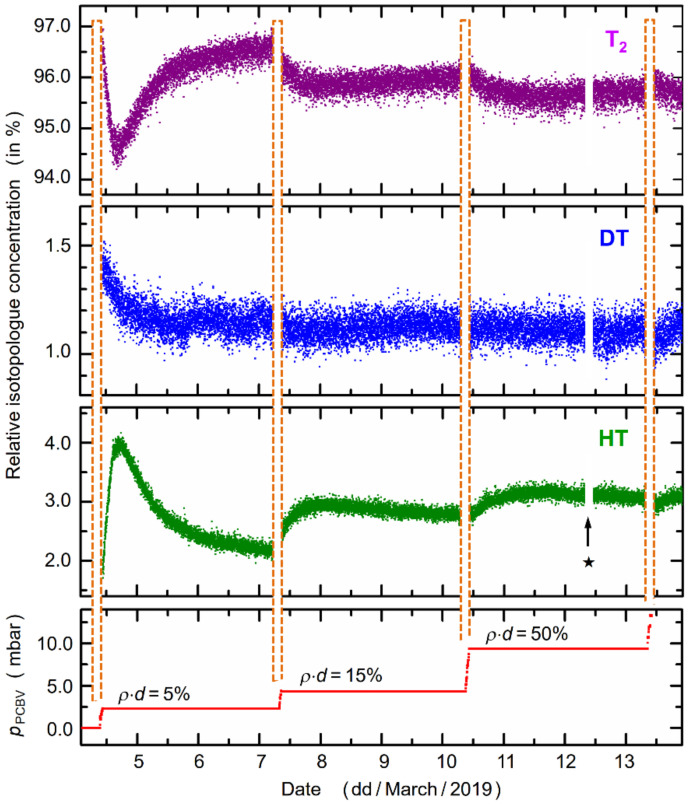
Figure 6.
Temporal change of relative isotopologue concentrations of the tritium gas mixture circulating through the WGTS, during the first ramp-up to full KATRIN operation during 4–15 March 2019. Top panels: relative concentrations for the three radioactive isotopologues T2, DT, and HT. During the time period indicated by the symbol ★, no data were available (caused by an intermittent data transfer failure); during the ramp-up change periods (indicated by the dashed vertical lines), the system response does not tend to equilibrium—these data are excluded from the long-term analysis. Bottom panel: monitoring data for the pressure-controlled buffer vessel (PC-BV) during the ramp-up—the related, nominal ρd values for the WGTS are indicated. For further details, see text.

